Part 1 of 3
Pick up any farm magazine or listen to any farm podcast and it won’t be long before the phrase “Costs of Production” comes up. Knowing costs of production is an important piece of management information and vital in many farm management decisions. Yet, as obvious as it sounds, pop open the hood and the messiness is revealed.
Two primary questions are 1) which cost of production and 2) how to calculate it. The second question on how to calculate becomes messy the more farm costs include multiple enterprises and co-products. A separate article titled “Costs of Production – How to Calculate” covers this challenge.
When calculating costs of production for a farm business, the answer depends on which calculation would be best to use.
Potential questions to consider include:
- all accrual expenses (depreciation, interest, other farm expenses, family living, etc.),
- all projected cash expenses this coming year,
- operating expenses only, and/or
- individual expenses such as feed, labor, or raising replacements.
Other questions to consider is how you want the costs of production expressed:
- absolute dollars,
- per sales unit (bushels, hundredweight, pounds, head, etc.),
- per production unit (acres, cows, etc.), and/or
- per dollar of total revenue.
There is not a right or wrong answer, it all depends on the questions. When analyzing past performance and wanting to know total accrual costs of production on a per sales unit basis, the accrual income statement might be used to find total costs for the numerator and divide that by the sales units sold. However, if the questions are related to cost efficiency, then analyzing feed, fertilizer, labor, and other operating costs per cow or acre may be more appropriate. If learning about price per sales unit this next year will cover projected cash outlays, use of a projected cash flow budget might be used and then divided by projected units sold2.
Figures 1 and 2 show a condensed version of the income statement and projected cash flow budget respectively for a dairy operation. These statements are a starting point for determining which cost of production. The accrual income statement is a measure of past performance of the farm business. The cash flow budget is a projection of cash outlays in the year ahead. These statements show the absolute dollars of costs with other columns showing costs of production per sales unit, production unit, and as a percent of total revenues (income statement only).
Figure 1 (Accrual Income Statement) is a measure of what occurred in the past. Resulting costs of production can be used to benchmark the same farm business over time, against industry standards, and/or against peers. Again, which costs of production to assess depends on the questions being evaluated.
Figure 2 (Projected Cash Flow Budget) is a projection of cash inflows and outflows in the next year. While it is not a measure of profitability, only cash exchanges are included as it is a measure of what cash needs to come into the operation to cover expected cash outlays.
In Figure 2, a price of $23.71/cwt if sales is needed to cover “Total Projected Cash Outflows.” A price over this may require the farm business to increase or take out a new operating loan. This high price has happened in the past, but it has not often. In this example, $230,000 of new operating loans are planned, creating a much more manageable price of $19.29/cwt of sales to cover remaining cash outlays.
FIGURE 1: Accrual Income Statement
Costs of Production
| Absolute Dollars | Per Hundredweight of Sales | Per Cow | Per dollar of Total Revenue | |
| 51,105 | 194 | 1,063,550 | ||
| Total Accrual Revenues | 1,063,550 | |||
| Operating Expenses | ||||
| Labor | 232,861 | 4.56 | 1,200 | 22% |
| Purchased Feed + Agronomic Exp | 414,184 | 8.10 | 2,135 | 39% |
| Custom hire | 45,920 | .90 | 237 | 4% |
| Repairs | 55,728 | 1.09 | 287 | 5% |
| All other operating expenses | 71,547 | 1.40 | 369 | 7% |
| Depreciation | 130,800 | 2.56 | 674 | 12% |
| Total Operating Expenses | 951,040 | 18.61 | 4,902 | 89% |
| Interest | 82,698 | 1.62 | 426 | 8% |
| Other farm expenses | 3,616 | .07 | 19 | 0% |
| Total All Farm Expenses | 1,037,354 | 20.30 | 5,347 | 98% |
FIGURE 2: Projected Cash Flow Budget
| Projected Cash Inflows and Outflows | Projected Per Hundredweight of Sales | Projected Per Cow | |
| 52,000 | 195 | ||
| Cash Outflows | |||
| Labor | 245,000 | 4.71 | 1,256 |
| Purchased Feed + Agronomic Exp | 342,200 | 6.58 | 1,755 |
| Custom hire | 40,000 | .77 | 205 |
| Repairs | 35,000 | .67 | 179 |
| Capital Asset Purchases less loan proceeds | 49,000 | .94 | 251 |
| Debt Service on Term Loans | 314,000 | 6.04 | 1,610 |
| All other cash outflows | 207,800 | 4.00 | 1,066 |
| Total Projected Cash Outflows | 1,233,000 | 23.71 | 6,323 |
| New Operating Loan Proceeds (cash inflow) | 230,000 | ||
| Total Projected Cash Outflows after Operating Loan | 1,003,000 | 19.29 | 5,144 |


 Margin Coverage Option (MCO) for Wisconsin Ag Producers
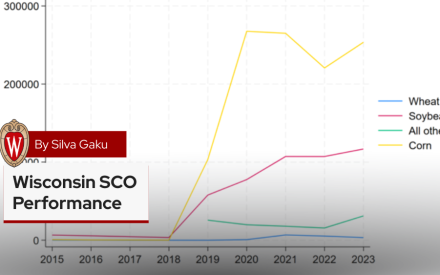
 Wisconsin Supplemental Coverage Option (SCO) Performance
 Forage Risk Management in Wisconsin, 2015-2024
 Managing forage production risk with Whole Farm Revenue Protection


