Part 2 of 3
There are many tools farm managers can use to inform their decision-making. One simple and effective tool for many farm management applications is breakeven costs of production. This is particularly useful in marketing decisions as the breakeven cost of production is the price needed to cover costs. If a profit goal is added to the breakeven cost of production, then the decision-maker knows what price will not only cover costs, but also a profit goal.
Breakeven analysis
Breakeven analysis starts with the profit equation:

A little algebra on equation “1” gives breakeven price:
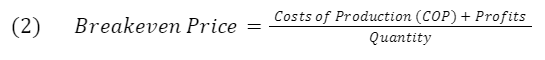
If profits are set to zero, then the equation reduces to the price needed to cover costs only. Note, that costs should include a payment for the owner’s management and labor. If this is the case, then at least some minimum return to management is included.
However, this should be considered only a first benchmark. Producers are not in business to just breakeven, even if some management return is included. A business, especially a capital-intensive business, like production agriculture, likely has significant debt service and has need to maintain and update capital assets (buildings, machinery, equipment, and breeding livestock), pay income taxes, and satisfy family living needs. Further, the goal of any business is to support future investment and growth, not just cover costs. Thus, including a value for “Profits” other than zero, gives a breakeven price benchmark that supports the long-term viability of the business.
Profit goal
What is a reasonable profit goal? One method is to sum needs for debt service, cash needed for capital asset replacement, income taxes, non-operating expenses, family living, and business profits needed for future investment and growth. Another method is to target a percent Return on Assets (ROA). Return on Assets is an often-used measure of operating business profits and thus is also comparable to peers and industry standards.
What’s considered a healthy Return on Assets is a sliding scale depending on the level of ownership versus leasing of assets. The Farm Financial Scorecard shows that on average a healthy Return on Assets is anything greater than eight percent. If most all assets are owned, then returns above 5% are strong, while if most assets are leased, a strong return is around 12% or greater. Table 1 shows a ten-year average Return on Assets of actual farms from Minnesota, Wisconsin, and Michigan. The data is sorted by Net Farm Income. A 5-12 percent Return on Assets seems consistent with more profitable farms.
TABLE 1: Ten-Year Average Market Return on Assets for Minnesota, Wisconsin, and Michigan Farms Sorted by Net Farm Income
| Low 20% | 20%-40% | 40%-60% | 60%-80% | 80%-100% |
| -1.2% | 1.4% | 3.4% | 5.4% | 9.0% |
Once a reasonable Return on Assets has been selected, or perhaps a range, then determining the profit goal is a matter of multiplying the Return on Asset percent by total assets of the business.
Example dairy and cash crop farm
- Managers desire to know breakeven milk price.
- Assume $4,000,000 of assets, which represents about 65% of the assets used on the farm. The remaining is land that is leased.
- Targeted Return on Assets is seven percent, or $280,000.
- About 70% of farm profits come from the dairy farm enterprise.
- 70% x $280,000 = $196,000 profit goal for the dairy.
- Total Costs of Production for the dairy enterprise is estimated at $900,000 (owner labor and management salary included).
- Sell 54,000 hundredweights of milk.
Given this information and using equation (2), the breakeven Costs of Production including profit goal is:

If this farm can sell its milk for $20.30, and if all costs and production hold as analyzed, then they have $196,000 to pay debt service, other non-operating costs, income taxes, family living, cash outlays for capital asset replacement and profits for future investment and growth.
If profits are set at zero, then the breakeven price that just covers costs is:

If this farm sells its milk for $16.67/cwt, and all costs and production hold as estimated, the farm will cover costs, but will not have profits for paying debt service, other non-operating costs, income taxes, family living, cash outlays for capital asset replacement, or profits for future investment and growth.
Range of breakeven prices
A final recommendation is to consider a range of breakeven prices. Life changes, sometimes quickly, and the best-laid plans today may not be feasible a few months later. Having a range of breakeven prices allows the manager to act quickly and informatively when changes occur.
Table 2 shows a range of breakeven prices for the example farm where profits are set to zero, but different levels of costs are analyzed. Table 3 shows a range of breakeven prices where costs are kept the same, but different profit goals are used.
TABLE 2: Range of Breakeven Prices Based on Various Levels of Costs of Production or Cash Flow Needs
| Cost or Cash Flow Needs | Breakeven Price | |
| 1 | Basic Operating Costs (operating costs before interest, depreciation, and labor) | 11.75 |
| 2 | Operating Costs including depreciation and labor | 16.67 |
| 3 | Operating Costs including depreciation, labor, and interest | 17.78 |
| 4 | Cash Flow Outlays (cash costs plus interest, principal payments, and capital expenditures) | 19.62 |
TABLE 3: Range of Breakeven Prices Based on Various Profit Goals
| Profit Goal Based on Return on Assets | Profit Goal | Breakeven Price | |
| 1 | Zero Return on Assets | 0 | 16.67 |
| 2 | 3% Return on Assets | 84,000 | 18.22 |
| 3 | 7% Return on Assets | 196,000 | 20.30 |
| 4 | 11% Return on Assets | 308,000 | 22.37 |
Implications for farm management decision-making
Knowing the costs of production and the associated breakeven prices are invaluable pieces of information for the farm manager. One application is marketing. Figure 1 shows the Class III milk price plus a $1.50 basis for the years 2014 through August 2022. The horizontal lines are the breakeven prices shown in Table 3. The information conveyed by Figure 1 gives the manager the ability to make an informed marketing decision.
FIGURE 1: Breakeven Prices versus Market Prices, 2014-August 2022
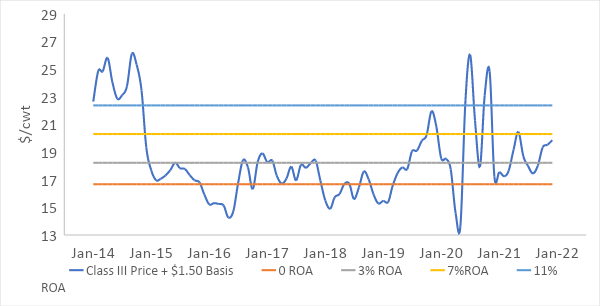
Of course, Figure 1 is looking backward. A more relevant use of breakeven prices looking forward is a comparison to futures prices that are currently available in the market.
Another way to use breakeven price information is by evaluating farm operations and where attention may be needed. Table 4 shows breakeven price information based on zero profits for actual dairy farms in Minnesota, Wisconsin, and Michigan that are of the relative same size as the example dairy farm.
TABLE 4: 10-Year Average Breakeven Milk Price (Interest Included) Sorted by Net Farm Income
| Low 20% NFI | 20%-40% NFI | 40%-60% NFI | 60%-80% NFI | 80%-100% NFI |
| $20.73 | $18.32 | $17.60 | $17.47 | $16.98 |
The example farm had a breakeven milk price, including interest expenses, of $17.78. Comparing this to the information in Table 4 indicates that either cost of production may be on the high side relative to production, or production is relatively low compared to costs. Either way, it is a breakeven price associated with the lower side of profitability and thus a potential place to spend management time tomorrow morning after breakfast.