Part 3 of 3
Whether it is marketing decisions, best production practices, human resource management or technology adoption, a major piece of information for the farm business decision-maker is knowing the costs of production. Two major questions in determining costs of production are how to calculate and which cost of production. This article discusses the first, how to calculate. Specifically, the challenge is how to calculate the costs of production for one primary product, say milk or corn, when total costs include costs associated with other co-products and/or enterprises.
How to calculate
The math seems simple. If dollars of costs per hundredweight or bushel are desired, then just take total costs and divide by the number of hundredweights or bushels sold. This is sometimes referred to as the “per-unit sold” method). However, the simplicity of the per-unit sold method can quickly become more complicated as operations have costs for products or operations other than the primary product in question.
Table 1 shows some financial characteristics for two farm mini cases, one is a dairy with milk as a primary product, but revenues and costs also come from cull cows, calves, soybean enterprise, and beef cattle enterprise. The other is a corn-soybean operation where the primary product is corn costs of production, but revenues and costs also come from soybean production, custom work, and rents from grazing corn stalks.
TABLE 1: Mini Cases Financial Information
| Dairy Farm Mini CasePrimary Product: Milk | Grain Farm Mini CasePrimary Product: Corn | |
| Units sold | 51,105 hundredweight (cwt) | 108,500 bushels (bu) |
| Average price | $17.57 per cwt | $5.60 per bu |
| Adjusted Total Farm Revenuesa (TR) | $1,170,957 | $1,073,100 |
| Primary Product Revenue | $900,233 | $607,600 |
| Co-Product Revenues | $153,550 | $5,000 |
| Other Enterprise Revenues | $117,174 | $460,500 |
| Total Costs (TC) | $1,224,257 | $914,255 |
| Costs for Primary Product Only | $965,502 | $583,730 |
| a Adjusted Total Farm Revenues is total revenues less government payments. This reduces distortion of costs of production as revenues from government payments have little associated costs. |
The per-unit sold calculation of costs of production is total costs divided by units sold.
For the dairy mini case:

For the grain mini case:

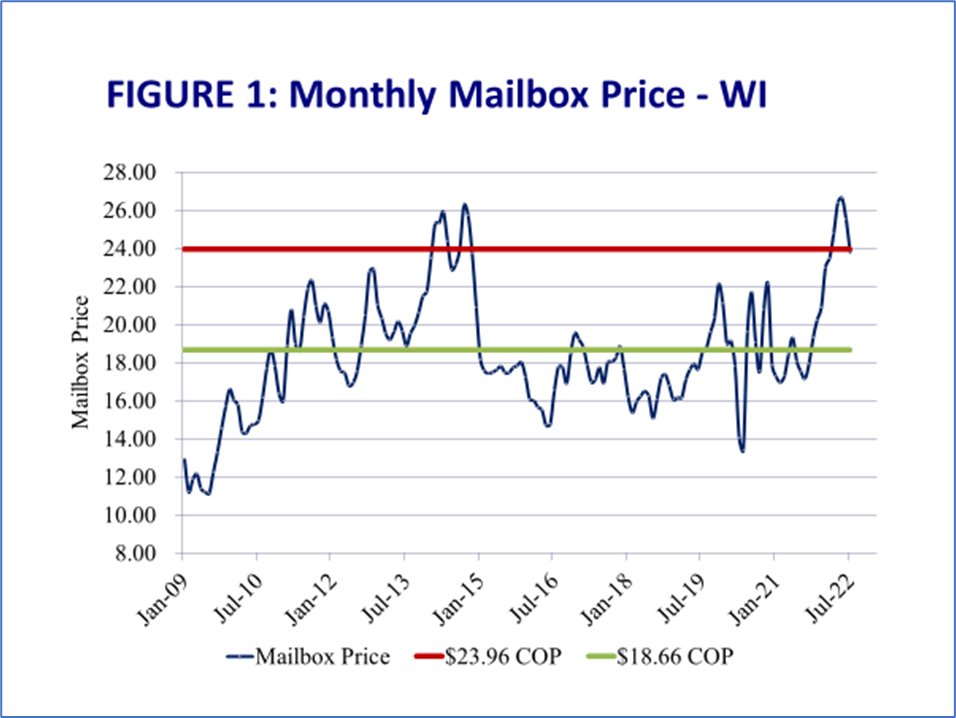
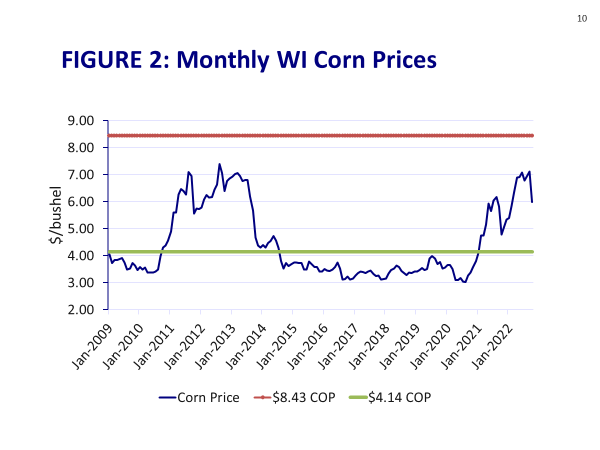
Figures 1 and 2 show graphs of monthly Wisconsin mailbox prices and corn prices respectively. The horizontal red lines show costs of production using the simple method. If this were truly the cost of production, then neither of these farms is profitable very often or not at all.
However, there is an allocation problem in that not all total costs shown in (1) were from producing milk or corn. Both farms had revenues and associated costs for either co-products or other enterprises. In the dairy mini case, cost of production includes costs for the soybeans, cattle, cull cows, and calves. For the corn mini case, total costs include costs for soybeans, grazing, and custom work. Thus, a way is needed to allocate the costs of producing just the primary product in question.
Five methods for determining a more accurate cost of production will be discussed and compared:
- Enterprise Accounting
- Residual claimant
- Unit equivalent
- Percent of total revenue
- Percent of cost item
Enterprise Accounting
Enterprise accounting is the gold standard for determining costs of production. Enterprise accounting involves a record-keeping system that allocates costs into the enterprises they serve. For example, feed costs for mature cows are separated from those feed costs for the beef enterprise. Similarly, fertilizer costs are separated for corn and soybeans or for corn used in the dairy versus fertilizer costs for corn that is sold. Once costs are allocated into their own enterprise, the numerator of formula (1) then becomes just those costs used to produce milk or corn. For the dairy mini case, costs for milk only were $965,502 and $583,730 for the corn mini case. Dividing these costs by the respective units sold gives actual costs of production:
- $18.89 per cwt for milk
- $5.38 per bushel for corn
This is the method recommended, however, not all farm businesses have the capacity to do enterprise accounting, thus the total costs for just the primary product only may not be known. While it is a goal to work towards, other methods can be used to at least get a close approximation of costs of production.
Residual claimant
The residual claimant is a method that subtracts certain revenue items from total costs and then applies formula (1). Two types of revenues are subtracted, each with an associated assumption.
The first type of revenues subtracted are those that are co-products of the main enterprise. For a dairy, co-products include revenues from the sale of calves, excess heifers, and cull cows. For a corn operation, a co-product may be the revenue received from grazing the stocks. The assumption is that these co-products are a recovery of costs, therefore subtracting them from total costs provides a more accurate total cost of production for just the primary product.
The second type of revenue subtracted from total costs are those revenues from other enterprises. For the dairy mini case, there were revenues from soybeans and beef cattle. For the grain operation, other enterprises included soybeans and custom work. A more challenging assumption made in this case is that the costs associated with the other enterprise is equal to the revenue generated by the other enterprise. If the assumption holds, or is close to being correct, then subtracting revenues from other enterprises from total costs leaves costs of production for just the primary product, milk or corn in our examples. However, the more this assumption is not true, the more inaccurate the resulting cost of production.
Using the formula (1) and information from Table 1, Residual Claimant costs of production are:

While there is room for improvement, looking again at Figure 1, an $18.66 cost of production looks much more competitive. Recall, the assumptions made were that the co-products are a cost recovery of producing milk and that the soybean and beef revenues equaled their costs.
For the corn example:

Again, Figure 2 shows the now more realistic corn costs of production versus market prices.
A disadvantage of using Residual Claimant is that it is limited to total costs of production only. Finding individual line-item costs of production such as feed, labor, and other costs is not viable using this method.
Unit equivalent (unitEQ)
Unit Equivalent is another method that adjusts total costs of production to just those for the primary product. It works by using a two-step process, the first being determination of the unit equivalents and the second being dividing costs of production by the unit equivalents. Unit equivalents are in the same units as the original product. For example, unit equivalents for hundredweights of milk are hundredweights and denoted as “cwtEQ” and for bushels of corn it is bushels and denoted as “buEQ.”
Unit equivalents are how much of a product would have to be sold (hundredweights, bushels, etc.) to receive the same total revenue that currently includes all co-products and other enterprise income. For the dairy mini case, total adjusted revenues including all co-products and other enterprises are $1,170,957. cwtEQ is the number of hundredweights that would have to be produced to receive the same $1,170,957 from just the production of milk only. Note, adjusted total revenue includes a deduction of government payments that do not have any associated costs.
Information from Table 1 and Formulas (3) and (4) below show the two-step process for calculating costs of production using the unit equivalent method.

Note, that the 66,645 cwtEQ are more than the actual sales of 51,105 cwt. This change will act as an adjustment when dividing it into total costs to adjust for non-milk costs. The second step is dividing total costs by the cwtEQ.

For the grain operation:


Note, the unit equivalent method’s accuracy improves if the primary product is 75% or more of total revenues.
Percent of total revenue
The assumption behind percent of total revenue method is that the percent of total farm revenues (adjusted for government payments) coming from the primary product is the same as the percent of total costs for the same product.
Formulas (5), (6) and (7) show the math.


For the corn example:


Percent of line-item costs
The final method is both more involved and likely the most accurate behind enterprise accounting. It is like the previous method except for an estimate of primary product cost is determined for each line-item cost and then summed. Tables 2 and 3 show a partial example of the dairy and corn mini cases respectively. Note, the same exercise could be accomplished by estimating total dollars for each line item attributable to the primary product.
TABLE 2: Percent of Line-Item Cost for Dairy Mini Case
| Cost Description | Total Cost | Percent of Cost Associated With Primary Product (milk)a | Total Milk Costs |
| Labor | 232,861 | 90% | 209,575 |
| Chemicals | 25,256 | 20% | 5,051 |
| Custom hire | 45,920 | 100% | 45,920 |
| Purchased feed | 275,459 | 90% | 247,913 |
| Fertilizer | 19,560 | 40% | 7,824 |
| Insurance | 24,522 | 75% | 18,392 |
| Repairs | 55,728 | 60% | 33,437 |
| Depreciation | 130,800 | 60% | 78,480 |
| . . . | |||
| All other costsb | 414,151 | 75% | 310,613 |
| TOTAL | 957,205 | ||
| Cwt Sold | 51,105 cwt | ||
| Costs of Production | $18.73 per cwt | ||
| a Percentages are an estimate by the producer/farm manager of the percent of each line item cost is attributable to the primary product only b “All other costs” in this table was a convenience for the size of the table. All costs should be itemized to use this method most effectively. |
TABLE 3: Percent of Line-Item Cost for Corn Mini Case
| Cost Description | Total Cost | Percent of Cost Associated With Primary Product (milk)a | Total Milk Costs |
| Labor | 26,000 | 50 | 13,000 |
| Fertilizer | 172,500 | 70 | 120,750 |
| Pesticides | 86,000 | 65 | 55,900 |
| Seed | 106,500 | 60 | 63,900 |
| Crop Insurance | 32,500 | 60 | 19,500 |
| Repairs | 40,500 | 60 | 24,300 |
| Fuel & Oil | 33,000 | 60 | 19,800 |
| Depreciation | 62,000 | 50 | 31,000 |
| . . . | |||
| All other costsb | 355,250 | 60 | 213,150 |
| TOTAL | 563,740 | ||
| Cwt Sold | 108,500 bu | ||
| Costs of Production | $5.17 per bu | ||
| a Percentages are an estimate by the producer/farm manager of the percent of each line item cost attributable to the primary product only b “All other costs” in this table was a convenience for the size of the table. All costs should be itemized to use this method most effectively. |
Summary
Knowing costs of production per production/sales unit is an often-touted goal for farm managers. Whether as information for making informed marketing decisions or determining where greater cost efficiencies could be achieved, costs of production is a vital piece of information in the farm manager’s toolbox.
The calculation of costs of production seems straight-forward, total costs divided by units of production. However, this simple per-unit sold calculation masks a significant challenge on most farms and that is the numerator, total costs, includes cost associated with other enterprises or other co-products. A cost of production for milk, corn, or any other primary product that includes the costs of other products is a distorted view. Said another way, why should the cows pay for the soybean enterprise or visa versa?
Thus, the farm manager needs a method for determining the costs of production for just the primary product in question. The gold standard is enterprise accounting where the farm records system is sophisticated enough to allocate costs into the various enterprises where they belong. However, if enterprise accounting is not yet available, there are other methods for getting a reasonable approximation, especially if the primary product accounts for 75% or more of total revenues and assumptions reasonably hold.
In this article, the math of the other methods was shown along with the assumptions of each method. Two mini cases, one for dairy and one for corn, was illustrated. Table 4 shows the results.
TABLE 4: Results of Cost of Production Methods
| Type of Method | Dairy Mini Case$ per cwt | Corn Mini Case$ per bu |
| Per-Units Sold (least accurate) | 23.96 | 8.43 |
| Enterprise Accounting (most accurate) | 18.89 | 5.38 |
| Residual Claimant | 18.66 | 4.14 |
| Unit Equivalent | 18.37 | 4.77 |
| Percent of Total Revenue | 18.45 | 4.80 |
| Percent of Line-Item Costs | 18.73 | 5.17 |
The actual costs of production from enterprise accounting for the dairy mini case was $18.89. The other methods that accounted for non-milk costs were reasonably close. In this case milk revenue was greater than 75% of all revenues and other assumptions, particularly other enterprise revenues being close to equaling other enterprise costs, fairly held.
Actual costs of production for the corn mini case were $5.38 per bushel. Other methods were certainly better than the per-unit sold estimate of $8.43 per bushel, but not as accurate as the those from the dairy mini case. Corn revenues as a percent of total revenues were just 57% for the corn mini case, much less than the 75% assumption. Also, revenues from the soybean enterprise were much greater than the associated soybean enterprise costs. The greater violation of these assumptions reduced the accuracy of some of the calculation methods.
While it is recommended that all farms continue to work towards enterprise accounting, it is also recommended to not let the lack of current capability prevent using other methods for determining an estimate of costs of production today.
References
Bolton, Ken and Gary Frank. “Cost of Production versus Cost of Production and then there is, Cost of Production!” (Cost of Production (wisc.edu)), Center for Dairy Profitability, University of Wisconsin – Madison, September 2009.
Frank, Gary. “Be Safe – Get to Know your COP.” (08 Know Your COP – Gary Frank.pdf), Center for Dairy Profitability, University of Wisconsin – Madison, March 2008.
Schnitkey, G., N. Paulson, C. Zulauf and J. Baltz. “Revised 2023 Crop Budgets.” farmdoc daily (12):183, Department of Agricultural and Consumer Economics, University of Illinois at Urbana-Champaign, December 6, 2022.