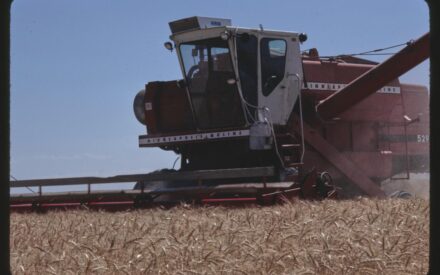
One of the foundational concepts of risk is probability, also known as the language of uncertainty. Let’s look at the concept of price risk with an example of the average monthly corn prices in the United States.
Prices of agricultural commodities typically vary around a long-run average but do not trend up or down, as shown in the chart from the University of Illinois. Market Year Average (MYA) prices represent the average price received for corn by all U.S. farmers and is calculated by the United States Department of Agriculture (USDA)’s National Agricultural Statistics Service (NASS).
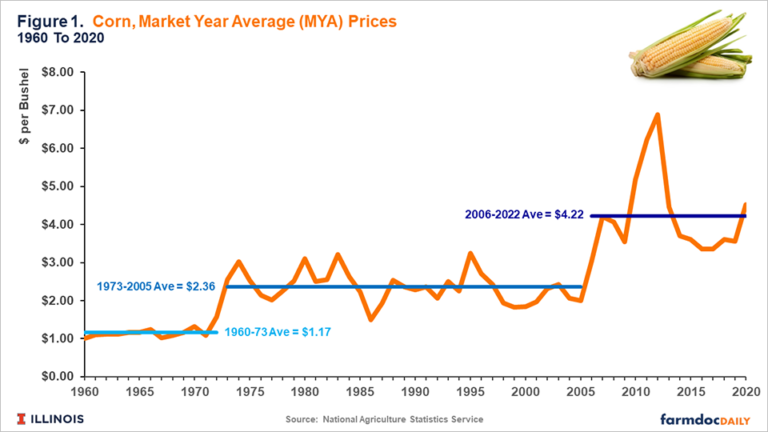
Three periods are illustrated in this chart.
- Prices averaged $1.17 per bushel from 1960 to 1973.
- Prices reached a new higher plateau in 1973. U.S. exports began growing in the late 1960s due to several evolutions in U.S. policy. In 1973, the Soviet Union made large grain purchases, reversing trade policy, thereby opening more markets to global trade. From 1973 to 2005, corn prices averaged $2.36 per bushel. Sometimes corn prices were considerably above the $2.36 average, as occurred in 1995 when corn prices were $3.24 per bushel. Some believed that prices had reached a new higher plateau, but they had not. Corn prices again went below the $2.36 average, falling to $1.94 per bushel in 1998.
- Prices again moved to a new higher plateau in 2006, primarily due to the growth of corn used in ethanol production. From 2006 to 2020, corn prices averaged $4.22 per bushel.
Monthly Corn Prices, 2014-2023
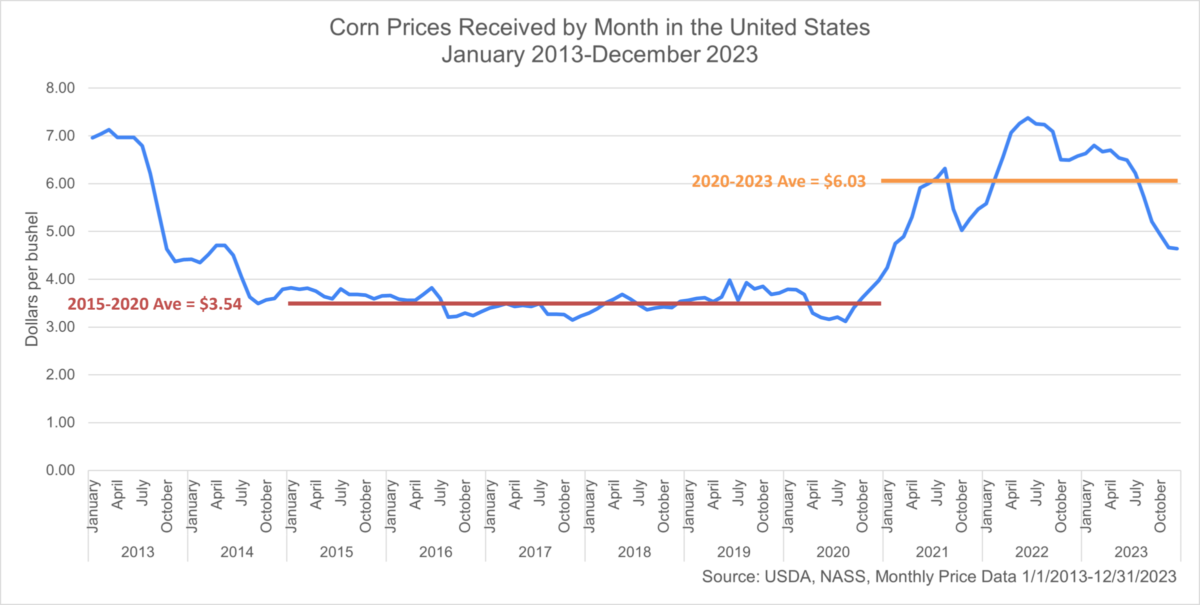
In the 10 year line chart, the average monthly corn price is represented by a relatively flat line from 2015 through 2020, with an average of $3.54 per bushel. However, since 2020, a large variation in corn prices has resulted in an increase of the average corn price received by U.S. farmers to $6.03 per bushel.
Exercise 1 – Reviewing Corn Prices
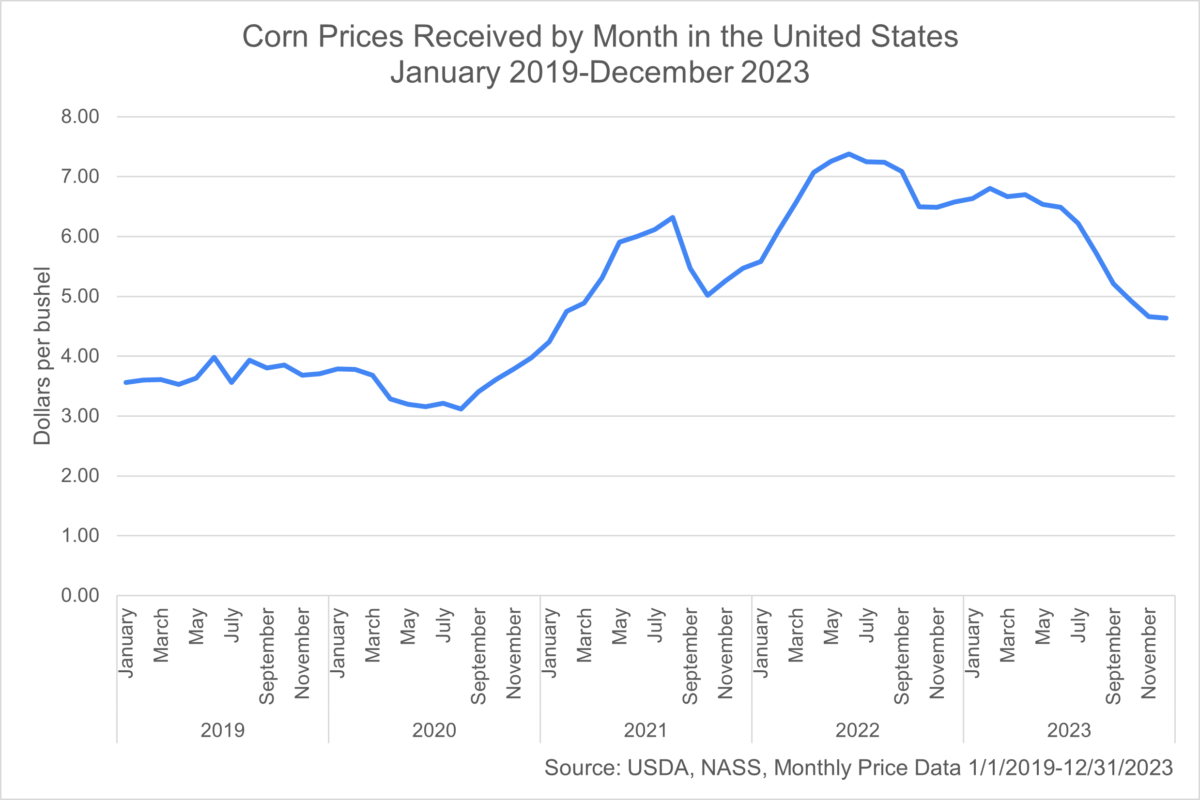
Let’s review the prices received for corn over the 5 years of 2019 through 2023.
- What was the very lowest corn price received during these 5 years?
- What was the average corn price during these 5 years?
- What was the very highest Corn Price received during these 5 years?
Exercise 1 – Answers
This line chart displayed represents the average monthly U.S. corn price received by farmers during the five years, from 2019 through 2023. The answers to these questions:
- The very lowest Corn Price received was $3.12 in August 2020.
- The average Corn Price was $5.02.
- The very highest Corn Price received was $7.38 in June 2022.
Exercise 2 – Reviewing Percent of Occurrences
Next, let’s review the percent of occurrences of these corn prices over the 5 years of 2019 through 2023. What percent of the time did each of the price estimates from Exercise 1 occur? How many times did the price occur over this period?
- What percent of the time did the lowest price or similar low prices occur during these 5 years?
- What percent of the time did the average price occur?
- What percent of the time did the very highest price or similar high prices occur during these 5 years?
Exercise 2 – Answers
The answers to these questions, using the monthly average prices received for corn for 2019 through 2023:
- The percent of the time the lowest prices were between $3.00 and $3.75 was 26.67 percent.
- The percent of the time the prices were between $4.00 and $6.00 in the past 5 years was 40 percent.
- The percent of the time the very highest prices were between $6.50 and $7.50 was 33.33 percent.
Exercise 3 – Distribution Curve
Finally, plot the answers written down from Exercise 1 of the monthly corn prices and Exercise 2 of how many times did the corn price occur. Place a dot on the chart that corresponds with these answers and connect the dots. A mountain shaped distribution should have been drawn, also known as the distribution curve. In any given marketing year or over a period of time, prices will often assume the shape of a mound.
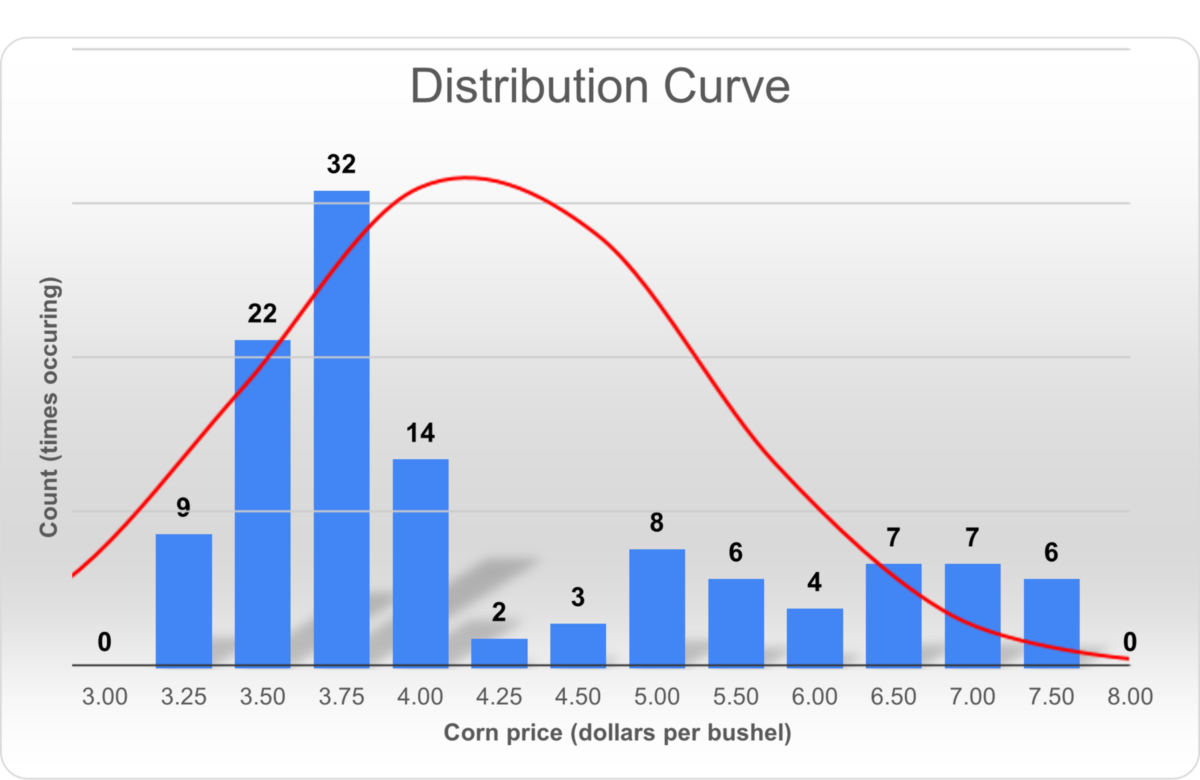
Distribution Curve, Monthly Corn Prices, 2019-2023
In the bar chart, the U.S. historical corn price received by farmers over 5 years, or 60 monthly prices, is shown. The bar height represents the number of times that a specific price occurred. As noted in Exercise 1, the monthly price per bushel of corn during the 5 years of 2019 to 2023 ranged from a minimum of $3.12 to a maximum of $7.38 per bushel. The average price per bushel of corn during this 5 year span was $5.02 with a standard deviation of $1.37 per bushel. There is great variation in prices from year to year and also within the same marketing year from month to month.
As you can see in the chart, the distribution curve for the monthly price of corn received by U.S. farmers between 2019 and 2023 is not a mountain shape. There is a long tail to the right side of the distribution, which is the result of a large range of monthly prices higher than the average price of $5.02 per bushel.
Normal distribution curve
The normal distribution is the foundation of price risk. The price values near the center of the distribution have a high probability of occurring. While higher and lower prices can occur, the probability of their occurrence is lower than the average price.
Part of a farmer’s efforts in reducing price risk is simply being aware of the potential outcomes or corn price that could occur. In this case, it is assumed that the corn price since 2019 may be an indicator of what the next couple of years may potentially offer. While certainly not full proof, history can often be a good indicator of the future.
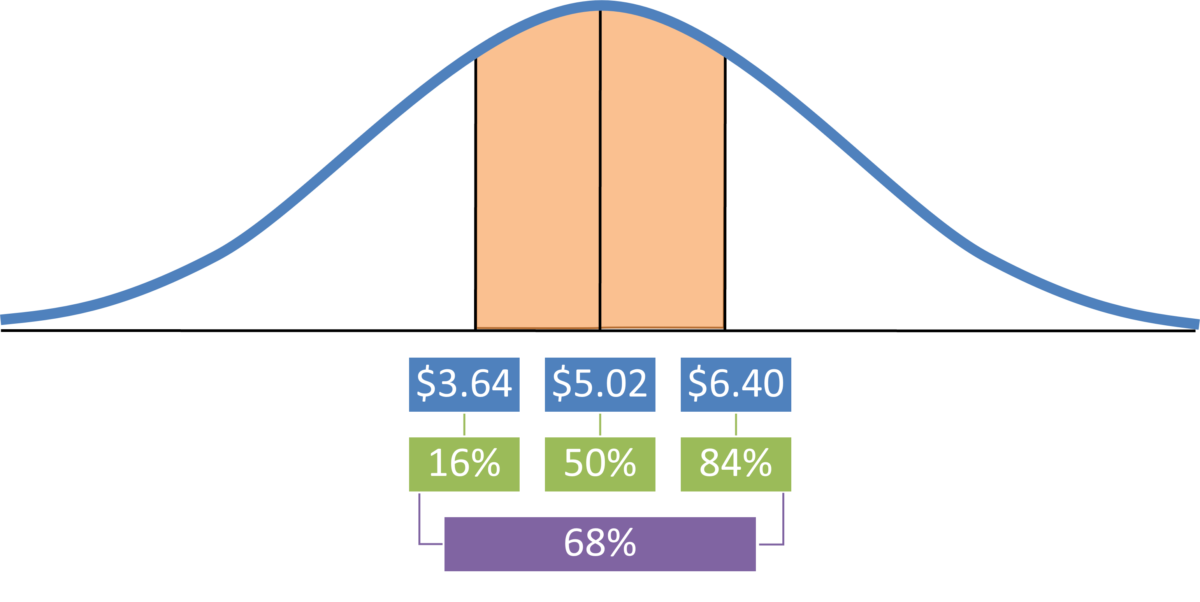
This graph shows the normal distribution of monthly corn prices received from 2019 through 2023. The monthly corn price fell in between the price range of $3.64 and $6.40 per bushel 68 percent of the time. For a limited percentage of the time, the monthly corn prices were either above $6.40 or below $3.64 per bushel.
The 84th percentile price of $6.40 means that eight out of ten times, the corn price per bushel fell below the price of $6.40 per bushel. Only for limited times or 16% were monthly corn prices above the price of $6.40. Half of the time over the past 5 years, the monthly price for corn was either above or below the average of $5.02 per bushel.
Price Risk Management
Risk management is about ensuring an outcome. Price risk management is ensuring what the outcome of the price will be. Let’s take a look at a few examples that describe price risk management and ensuring the outcome of the corn price received.
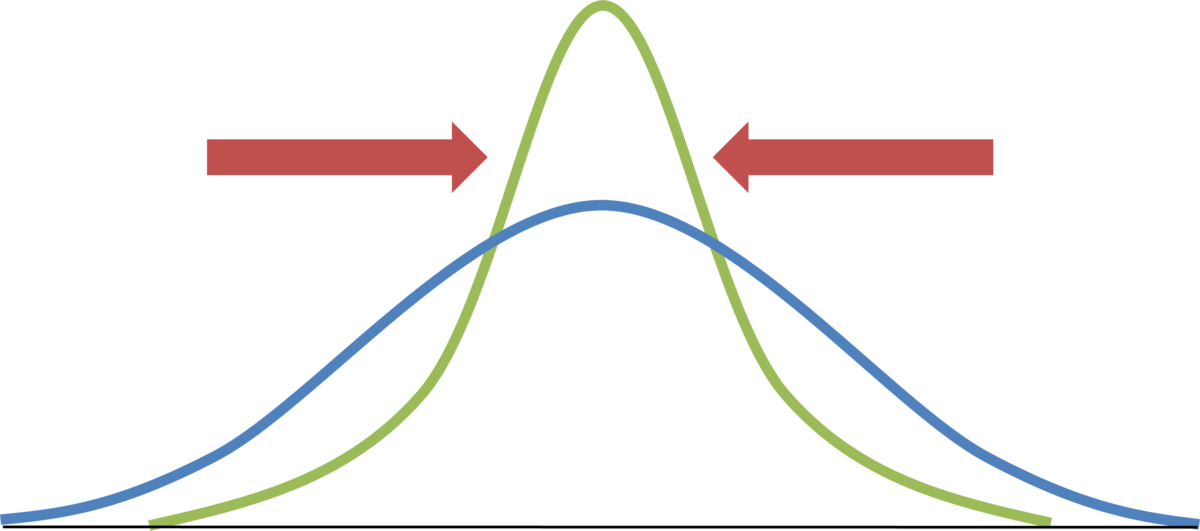
As this diagram shows, a visual way to think about price risk management is trying to “squeeze” in the normal distribution, i.e., ensuring an outcome of the price. By squeezing the distribution, a farmer has a higher and higher probability of getting a more average price instead of a lower price. Price risk management is about changing the distribution of prices.
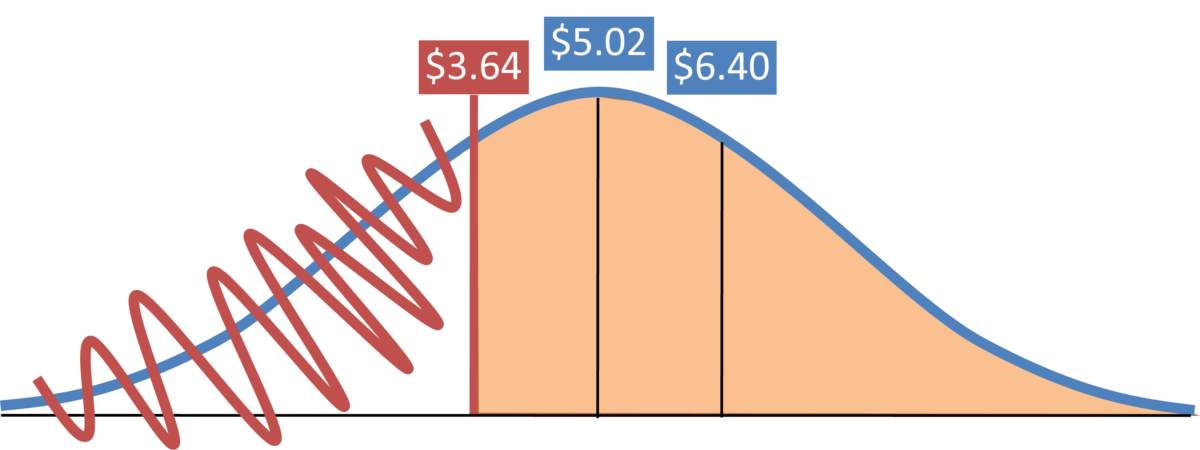
This graph shows what happens to the distribution when a farmer establishes a price floor. In this example, a price floor established at $3.64 per bushel eliminates the potential outcome of receiving a corn price that would be below this value. A farmer is limiting the potential negative outcome by establishing a price floor and allowing for more beneficial results, i.e. higher corn price per bushel to be received. They are guaranteeing they will not receive a price less than $3.64 per bushel.
Summary
We have just covered the basics of statistics and the basic understanding of the concept of risk. This article has illustrated that there is more than one potential outcome resulting from any event and that there is a different likelihood (or probability) associated with each outcome.
Although a farmer may not recognize it by name, they will intuitively understand the interpretation of the normal distribution, and in-fact make decisions based on a normal distribution most every day. The goal is to reduce price risk and limit the potential negative outcomes while taking advantage of positive outcomes.
References:
- Schnitkey, G., C. Zulauf, N. Paulson, K. Swanson and J. Baltz. “Are Long-Run Prices Still $4 for Corn, $10 for Soybeans, and $5.50 for Wheat?” farmdoc daily (12):79, Department of Agricultural and Consumer Economics, University of Illinois at Urbana-Champaign, May 31, 2022. Retrieved 01/03/2024 from https://farmdocdaily.illinois.edu/2022/05/are-long-run-prices-still-4-for-corn-10-for-soybeans-and-5-50-for-wheat.html
- United States Department of Agriculture (USDA). Prices Received: Corn Prices Received by Month, US. Retrieved 01/03/2024 from https://www.nass.usda.gov/Charts_and_Maps/Agricultural_Prices/pricecn.php.
This material was developed by the University of Wisconsin–Madison Division of Extension in cooperation with the U.S. Department of Agriculture and Wisconsin counties. This material is based upon work supported by USDA/NIFA under Award Number 2021-70027-34694.