Part II of a Two-Part Series on Management Process Tools You Can Use
How often have great ideas not been realized due to obstacles in implementation? If some of my great ideas had been implemented, then I would be an owner of a vineyard, bookstore and creamery, have my pilot’s license, and have a restored 1971 Chevelle Super Sport in my garage. In Part I of this series, ways to generate creative ideas were discussed via brainstorming and nominal group technique. In Part II, the discussion turns to clearing obstacles that litter the path to implementing important decisions on the farm through the use of two continuous improvement tools – Fishbone Diagram and Forcefield Analysis.
Fishbone Diagram
According to my “Memory Jogger(1)” handbook, Fishbone Diagram (aka Cause and Effect Diagram) was developed to represent the relationship between some outcome or “effect” and all the possible “causes” influencing that effect. The effect could be a positive, desired, outcome or it could be negative. Either way there are causes or influencers.
Figure 1 shows where the name comes from. The desired “effect” is on the right side (fish’s head). All the “causes” influencing the effect are identified on the left side of the diagram. The left side (fish’s body) starts with major categories (major bones). Major categories are whatever is appropriate for the effect or problem being studied. Typically, there are 3-6 major categories including, but not limited to:
- people, equipment, procedures, policies, regulations/laws, materials, environment, measurement, environment, decision-making, communications, facilities, livestock, and financing.
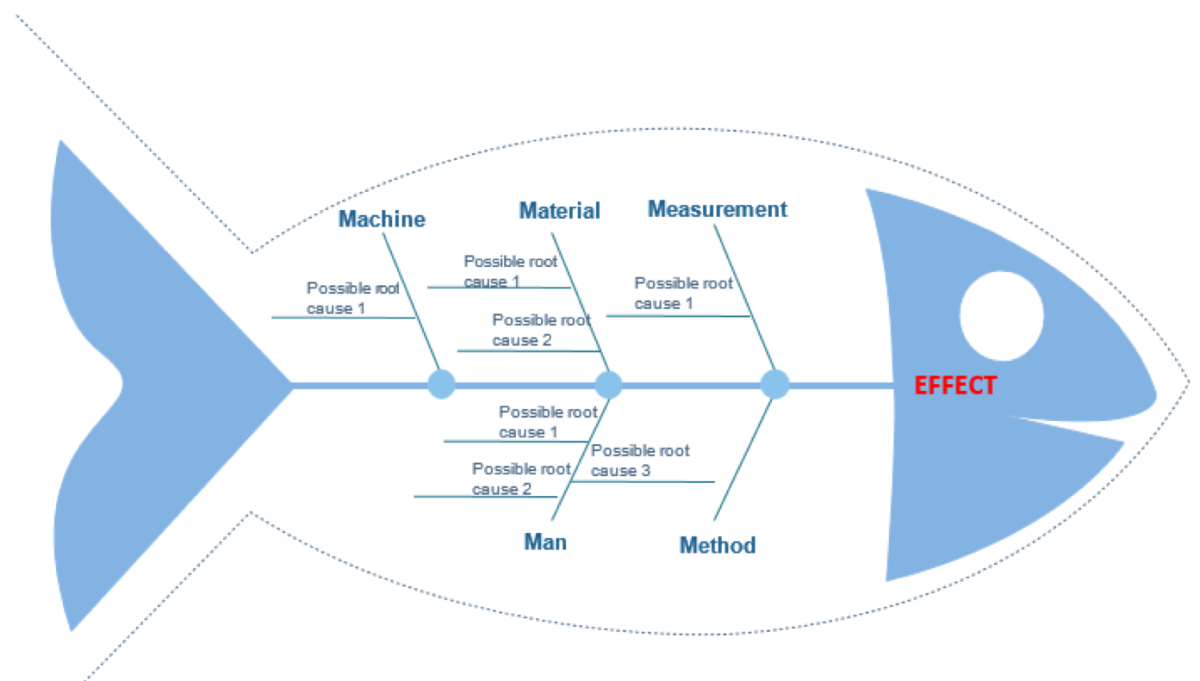
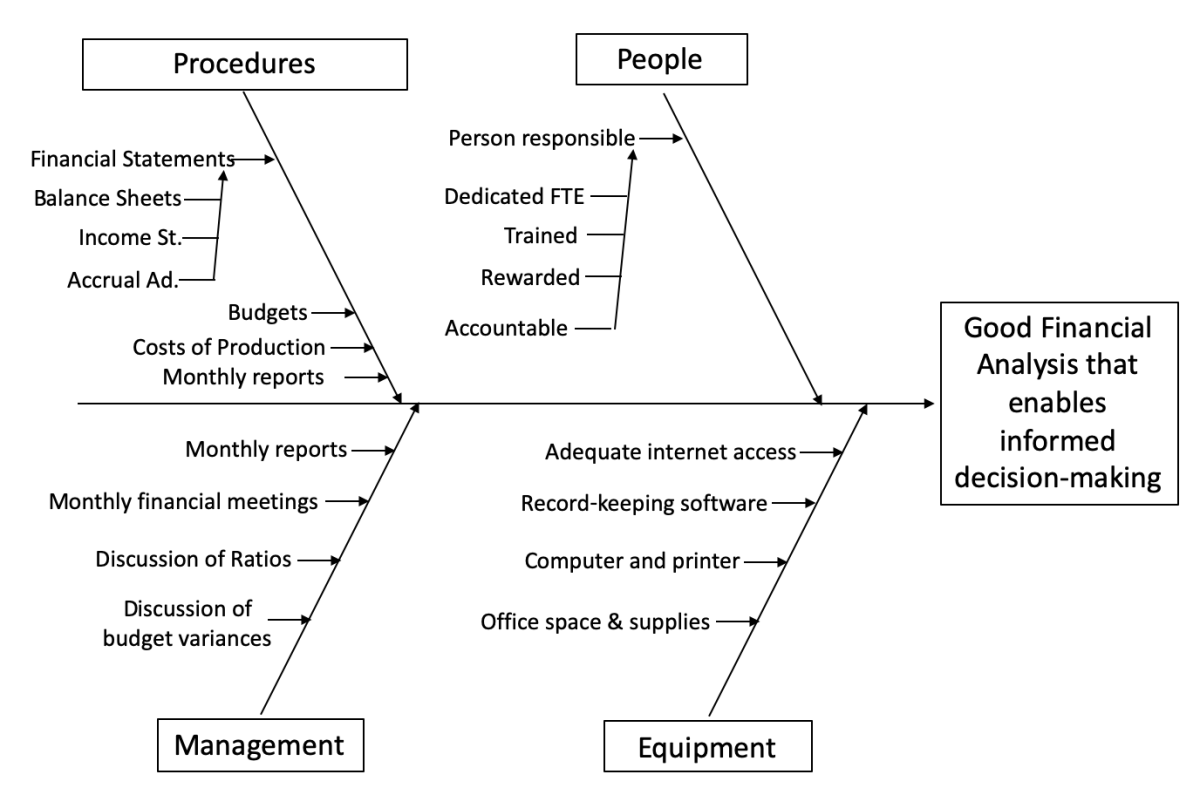
Once the major categories have been identified, then the work of finding the root causes begins. The root causes are a line off a major category (small bones). Figure 2 is an example of a Fishbone Diagram where the desired effect is good financial information that enables informed decision-making.
Figure 2 is broken down into four major categories and root causes of good financial information are identified. Once completed, the next step for managers is to assess the root causes and assure that the operation has the right procedures, people, management, and equipment in place. Causes that are missing or lacking are potential obstacles preventing a successful outcome and are a place for managers to spend time tomorrow morning after breakfast. The idea is to build a good structure for success and the desired effects will follow.
Note, the Fishbone diagram could be constructed from the negative point of view. That is the effect could be a problem (poor financial information) and the bones are the identification of root causes of poor financial information.
Forcefield Analysis
Forcefield Analysis is one of my favorites, partly because it has a cool name. Forcefield Analysis is a recognition that there is a path from where we are today to where we hope to be in the future. There are driving forces that motivate staying on that path and restraining forces that block the way. Success in accomplishing the goal may be increased by both strengthening the driving forces and/or reducing or eliminating the restraining forces.
Driving and restraining forces include people, resources, policies, regulations, attitudes, financials, skills, and much more. Figure 3 illustrates an example of the process. It is a non-farm example, but perhaps one that many would identify with. The goal, or destination, is to improve my health by doing a regular exercise program of running and weightlifting at least 3 days a week.
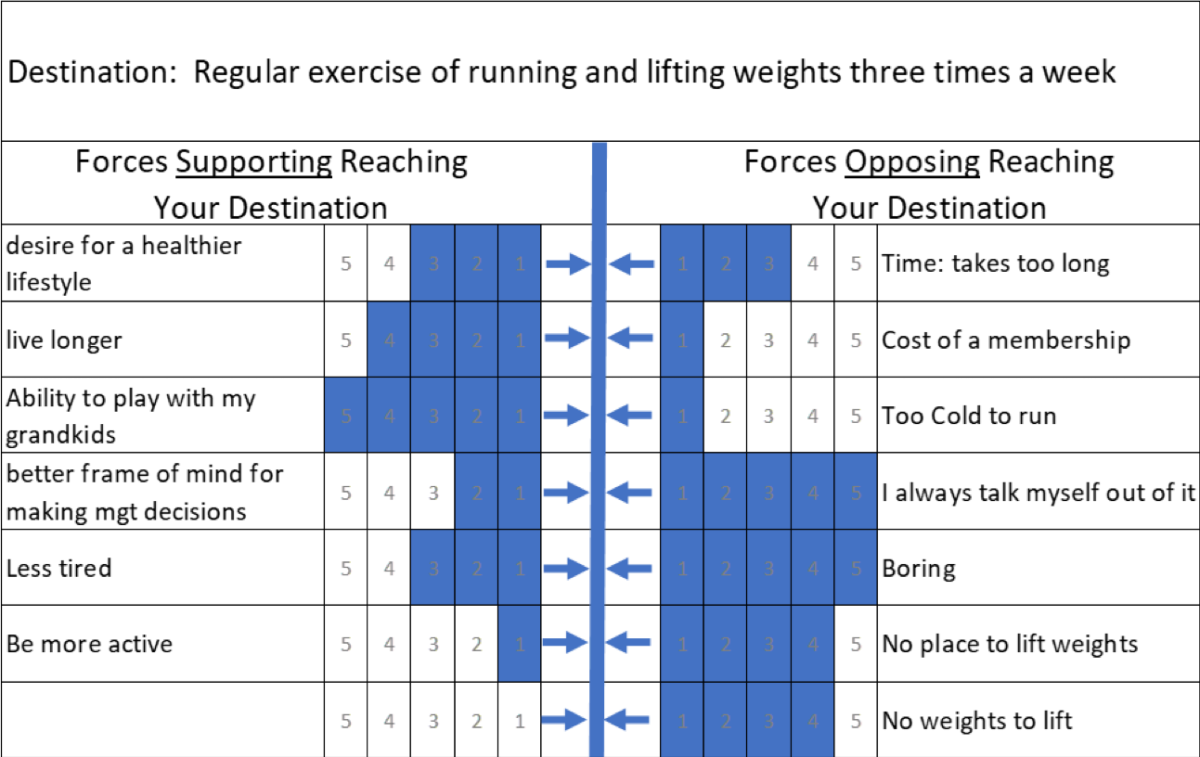
The first step is to put in writing your goal or destination. A common acronym for writing an effective goal is SMART. Is it specific, measurable, accountable, realistic, and timed? The statement written in the example meets all these criteria with possible exception of accountability. Accountability is acknowledging who oversees making sure the goal happens. Perhaps, I should put my spouse in charge of that!
The second step is to put in writing in the left column the driving forces, that is those elements that support or motivate achieving the goal. The third step is to assess the strength of the driving forces (1 is low influence and 5 is high). In my case, the ability to roll around and play with my grandkids is a huge motivational factor for me and living longer is motivational as well.
The next two steps are to do the same, but in the right column, which is identifying the restraining forces that are preventing goal achievement. In my case, it is my own head that is talking myself out of exercising and part of that is because I find it boring!
With knowledge of factors either driving or restraining achieving this goal, I can now make management decisions that strengthen the driving forces and reduce or eliminate the restraining forces.
Dairy examples might be improving cow comfort, lowering SCC, decreasing feed waste, employee retention and development, or even completing a comprehensive strategic plan. Once the driving and restraining forces along with their influential strength have been identified, then management can work at ways to strengthen the driving forces and reduce/eliminate the restraining forces with focus on those most influential.
Note, in some situations especially those working with employees or even other owners, strengthening the driving forces can have the result of a counterbalanced strengthening of the restraining forces, which you don’t want. Let’s be honest, if family or others attempted to strengthen my driving forces by hammering on me about being healthier and how much better I would feel if I shed a pound or two, I may let my stubbornness rise and, while not meaning to strengthen my restraining forces.
Your road to achieving big hairy audacious goals, may be littered with obstacles, problems, or just missing pieces of the puzzle. Perhaps a Fishbone Diagram will help identify a missing puzzle piece, or a Forcefield Analysis will help identify the driving and restraining forces preventing achievement. While you might not have a lightsaber to cut your way down the path to success, perhaps you can identify and fix the missing causes, strengthen driving forces, or reduce/eliminate restraining forces all of which will increase your probability of achieving your great ideas.
Reference
- Memory Jogger 2, Tools for Continuous Improvement and Effective Planning, https://goalqpc.com/