2025 Wisconsin Agricultural Outlook Forum
Farm Income Situation and Outlook
Summary
In this presentation, Paul Mitchell, Extension specialist and professor of agricultural and applied economics for the UW-Madison College of Agricultural and Life Sciences, outlines the current state and future outlook of farm income in the U.S., focusing on key metrics such as net farm income, production conditions, and economic indicators. He also touches on government assistance programs and policy updates in Wisconsin and nationwide.
At the Ag Outlook Forum, Mitchell outlined a multifaceted view of the agricultural sector, revealing both challenges and opportunities ahead. With declines in crop revenues juxtaposed with livestock gains, as well as the influence of weather patterns on productivity, farmers must adopt innovative and sustainable practices to thrive amidst fluctuating economic conditions. This outlook highlights the importance of government support to facilitate farmers’ resilience in an ever-changing landscape.
Highlights
Decline in Net Farm Income: Net farm income is projected to decrease by about 6% compared to last year, although it remains above the 20-year average.
Crop Revenue Drop: Crop revenues have seen a significant decline, notably in soybeans, which are down by approximately 12%.
Livestock Revenue Growth: Livestock producers are experiencing a positive trend, with revenues increasing by 8.4%, particularly in the cattle and dairy sectors.
Weather Impact on Crop Conditions: The end of the 2024 growing season was marked by drought in parts of Wisconsin, adversely affecting crop yields.
Economic Indicators: Land values have stabilized after years of increase, and interest rates are showing a downward trend, which could benefit farmers.
Tight Profit Margins: For 2025, farmers are expected to face tight margins, with break-even prices for corn and soybeans indicating potential losses.
Government Assistance: The recent policy updates include substantial disaster assistance funds and extended farm bill provisions, which could provide some relief to farmers.
Insights
Economic Pressures on Farmers: The decline in net farm income, despite being above the historical average, reflects broader economic pressures in the agricultural sector. Farmers are navigating fluctuating prices for crops and livestock, which complicates financial planning and stability.
Divergent Fortunes Between Crop and Livestock Producers: The stark contrast in financial health between crop and livestock producers highlights the volatility within the agricultural sector. While livestock producers are thriving, crop farmers are grappling with significant revenue losses, illustrating the need for diversified farming strategies.
Weather’s Role in Agricultural Productivity: The impact of weather on crop yields cannot be overstated. The presentation illustrates how adverse conditions, such as drought, can drastically affect agricultural productivity, underscoring the importance of climate adaptability in farming practices.
Stabilizing Land Values: The stabilization of land values, after a period of rapid increases, indicates a potential leveling off in agricultural investment. This shift could influence rental rates and long-term planning for farmers, necessitating careful financial management.
Interest Rate Trends and Their Impact: The decrease in interest rates signals a potential easing of financial burdens on farmers seeking loans for operations or land purchases. This trend could encourage investment in agricultural technology and sustainability practices, which are essential for long-term viability.
Challenging Profit Margins Ahead: The projection of tight profit margins for 2025 emphasizes the need for farmers to adopt innovative practices to maintain financial health. With break-even prices indicating losses, there is an urgent need for cost management and revenue enhancement strategies.
Government Support Mechanisms: The government’s provision of disaster assistance and the extension of the farm bill signify a recognition of the challenges faced by farmers. Understanding and leveraging these programs will be crucial for farmers aiming to navigate the impending economic landscape effectively.
Transcript
Farm Income
00:02
all right welcome everyone um so what I'm going to do is do a quick farm and in farm income situation and Outlook where we are now and where at see 2025 going this will sort of about the big this is from the USDA back in November um it's the um the net farm income this is sort of the all of agriculture in the US you know from broccoli to Apples to cows and pigs and um you know chickens and all that kind of stuff corn and soybeans are a big one obviously they're showing us down about 6% from last year we're still though

00:32
that 20year average so it's not as good as it has been 2022 is a record we're down from that but um so things are slowing down and tightening up and what really this is cash receipts this is how much you get from selling stuff on the left is crops on the right is livestock and those numbers are the they're both so you kind of get a sense of the scale of sales of what we produce on the left is crops we're down 99.2% on crops revenues on the right is livestock it's plus 8.4% so what you're seeing is how

01:06
is the farm economy doing depends who you're talking to livestock producers or um crop Farmers you can see almost 21% in cash revenues this is from 23 to 24 um soybeans down about 12% you switch over to livestock it's all um Roses and Rainbows Plus 7.2% for the um cattle and Cales Dairy almost 12% up from last 23 to 24 broilers are up 6% eggs y really booming in terms of um cost well from the far the retail P Farmers perspective revenues are up 39% now let's look at the production year this is how did the 2024 crop

01:45
season go which you have on the for corn and soybeans on the left is Wisconsin on the right is on the United States as a whole the percentage of the acres in what we call good to excellent condition this is what the market likes to watch to see how the crop is progressing over the season um corn is the top two soybeans is the bottom two there um and what you see 2024 is the red line and that's the and then you have the last other several years there what did what was 2024 like and was last year last

02:13
year was a little rough but it's still not like it's always been we're been behind um both corn and soy beon state were not as good as they were in 2020 2021 Etc whereas the at the US level things were a lot better it was the red line is much more on the upper end where a lot more the crop is in good shape so we had our not quite perfect year look at the data this is um just for Wisconsin this is 2024 started out wet there that top left is the um temperatures right on average we had average temperatures in the bluish green

02:43
there the aqua is precipitation it was above average there for um the beginning and then at the end it started getting average then you really saw the pration fall off it got dry now the bottom figure there is that good to excellent condition it's pasture though this is a USD Nast day done pasture think of the landscape I use as a way to understand what's going on what did you see out there and you can see 2024 look pretty normal on the upper end the landscape was green doing fine and then all August

03:13
is starting to slow down but September and October it really drops off that's that dry weather so on the right there um July 23rd that's the drought monitor for the state of Wisconsin clean there's no drought no dryness anywhere less than two months later September 17th you can see how half the southern chunk of Wisconsin is in it's AB drought up there in the north as well we really saw that end of the season um really dry up and that affected our crops um these just came out back in January 10th a little

03:42
bit ago these are the USDA yield estimates for um from nas for the um corn on the left and soybeans on the right by state and I got it highlighted there so you can read 174 bushels for corn that's 1.1% less than last year whereas the soybeans um 48 bush almost 6% less than last year you can kind of see that band of red Minnesota Wisconsin Indiana then further Eastern corn Bel the same thing with the soybeans these are low um they're not they weren't horri the corn was fifth highest ever soybeans is eighth highest and that end

04:17
that dry at the end of the year really affected the soybeans the way it would described to me was yes the pods are full but they the the beans are the size of bees they're not big like they're supposed to be they were much smaller and so it really affected our yields especially on the soybean so let's look forward coming for 2025 um this is the weather on the bottom right there January 16th is the drought monitor it's dry we got a brown winter happening here but it's you can see the brown on the Northern Wisconsin down

04:43
here in the souths Eastern as well slide over though that map at the bottom with the brown and the other colors what the Noah is predicting is drought status for the state we're going to clean that drought up we're going to get moisture on the top left is our temperature expectations for April May and June average basically saying we're not looking for anything unusual in terms of temperatures equal chances of above and below average on the other side though you can see the green for the precipitation it's likely to be a April

05:13
May and June looks to be there's a little bit more chance of being higher than normal temp um precipitation so what's coming for 2025 a wet start again but should be normal temperatures now let's switch over to sort of the economic stuff this is the usda's estimate of cropland value so we're going to move into economic indicators what you see here is that the um the percent you'll our land values went up a few percent 2 3% you see that same thing in the other states here in the Midwest um you know Minnesota Iowa

05:41
Illinois um you go further east you got bigger jumps there in Michigan and um States like that but it's um been a small climb up and these are the same data just for average Wisconsin and red you see the last several years there we've gone through a big land value increase both in the US and in Wisconsin here but what you see I think is that land values are beginning to stabilize we're not going to see the we saw years of flat land values then we saw that big jump we're kind of done with that um

06:09
land Valu R up 2.7% from 2020 a lot of indicators that that is slowing down but it does affect rental rates these are the average rents um on the left are the state or the counties that had the largest jumps in the average rental rate for crop land the dark green is um 14 to 16 um lighter green is um 10 to 12 is 8 to n those are the leading ones all the other ones had small changes as well but um then I showed the top um counties there in the state and what you see is the percentage changes here DNE County had an almost 8%

06:44
increase same with Kiani up in the Northeast there but then you see Grant and Lafayette are leading counties they had very small changes um for brown wall wereth for the year but you can kind of see some of these counties had small increases small decreases but you know things are slowing down but there's a few areas that are catching up yet um next one is interest rates I'd like to point this one out interest has been a big question for a lot of people um they're finally coming down this is from the Federal Reserve Bank out of

07:11
Chicago that s where we're big chunks of Wisconsin are but you see it was about 8 and a half and 7 and a half% and we're finally seeing the fourth or the third quarter here back at the end of October or beginning of October the interest rates have started to come down just like we've seen elsewhere that will affect operating loans and land loans now what I want to do is talk about infl on what at the farm level as well as but not the consumer as much we'll talk briefly about the consumer but you can

07:38
see the producer price indexes when you don't hear about as much this is the cost of things to all the production stuff in the economy not just Agriculture and this is something the um St Louis Federal Reserve puts out this is the producer Price Index this is the all Commodities this is for farms and businesses buying stuff to make things with you can see it was very flat for years after the Great Recession we had that little blip the gray is a recession that was covid and then you saw the big jump in in on commodity prices the

08:07
producer price index and then it's been level ever since Goods Goods have been fairly in terms of prices but you really see that the Consumer Price Index is continually grown all through this stuff it's been it's even accelerated there and we've all seen that at the grocery stores and other places how food prices have gotten up we're back on Trend but they're still growing whereas the the good side um at the economy is flat consumer prices to costs of services and housing that's what you really look at

08:35
they've broken it out and it's going to be things like healthcare insurance accommodations Transportation it's not the gas it's getting the person to take you somewhere it's not the building it's the heat it's not the heating the building it's having someone take care of the building fix your car drive the vehicles um or take care sell you the policy it's not the that have really been affecting are the driving the inflation in the economy same thing in agriculture this is USDA 23 to 24 changes the bottom are

09:02
decreases in cost the top is increases and what you see is that goods are all going down in cost that's your things like um feed fertiliz pesticides um fuel those have been decreasing cost from 23 to 24 whereas the the service oriented things that require people of all going up labor obviously um and I haven't hard time read oh interest you know property um taxes and such the beef cattle buying um feeder cattle has always gone up as well that's driven we'll let Brenda talk about but input costs are declining

09:34
service costs are increasing this trend is going to continue into 25 I don't see any change in that now I'm going to talk about the 25 crop this is for corn and soybeans these are what Farmers going to be put in the ground soon these are the break even prices you got Northern Illinois from the University of Illinois you got it just can't both these have been updated and they're out in January W extension hasn't quite gotten their Done Yet that'll be done soon but that's the 24 prices and this is the 25 Break Even

10:01
prices in the percentage change from last year to this year from 24 to 25 you can see um Break Even costs are down in Illinois 7% um for corn 5% if you look at Iowa State you're talking about 6% only down about a%c for soybean if you apply those same things to Wisconsin you get those numbers in red down there if you do the seven or the 5.4 whichever one you want whichever budget we're going to be somewhere in this region though and what you're going to see there is about $490 for corn and um 12

10:29
1240 for soybeans here's thetion of the farm average price for the year $3.90 for corn and $10 for soybeans so Break Even prices 490 1240 those are the average Farm prices for the year we're looking at the average Wisconsin Farmers looking at a margin of a negative dollar per busher for corn about 240 for soybeans they're going to be losing cost of production includes you know things like paying themselves returns to land and stuff like that but um this is tight margins out that's the story for 2025 for crops

11:01
tight margins this is a publication called balancing sustainability Innovation that W extension Specialists put together this is sort of the collective wisdom of the you know the I'm people that do Agronomy the weed management the nutrient management it's 16 pages of things on how to deal with these tight margins sustain being economically sustainable but also you can't give up you got to think about how to move forward and move your business move your farm forward that's the Innovation side how you balance that in

11:30
these tight margins the collective wisdom of the extension um um the crop we'll call them the cropping systems people so the last thing we'll talk about quick briefly is this um policy update continuing resolution passed at the end of at the end end of the year included 21 billion for this a Disaster Assistance that's primarily for the hurricane I don't Wisconsin producers but there was also 10 billion in emergency economic assistance we're still waiting for the details um but um projections these are just you've seen

12:02
different numbers out there you can find some other ones but around $425 doar for corn soybeans around 29 bucks um 30 bucks wheat you can see the numbers there oats as high as $78 take these numbers that's about $240 million coming to Wisconsin producers um the other thing that the continuing resolution did is extended the 2018 farm bill for one more year that's Aran PLC so they've started the sign up for the 2025 crop for Aran PLC starts today our friends at Farm Service Agency are busy with that past I have these recommendations I

12:34
put this together people can get the real short little sheet of paper that I understand they hand out at these sign up meetings or they have other ways you can get it you get all the details there if you want to know more about why I say this but PLC for corn and they've got a few base acres in sorghum and sunflowers is also PLC and then County Ark for soybeans and all our small grain oats and barley um that's where I think is the best deal but you can wait around for the Baseline to come out in

12:57
mid-February for estimation of prices um prospected plannings what's different this year is it ends in April 15th because of the delay in getting it started so you have an extra month so you can actually wait for the prospective plannings report to come out so this is the farm income and then we're done is um government payments are another source of money um besides crop revenues livestock revenues this is the payments over the last few years and what you see during the pandemic we had record payments going out PPP loans and

13:26
all these cfat payments and everything the bottom there is um really falling down to these more less than 10 billion these new changes I'm we're looking at these new monies going out that will be made paid in the 2025 year it's going to it's over 35 billion right now plus some more from these commodity programs there's some pretty good chances Arc will pay for several counties here in Wisconsin it doesn't take big yield declines at the county level to trigger these Arc payments it's 2% for corn soybean 7%

13:54
wheat and oats you can see that we had that sort of slightly below average year corn and soybean yields were down I think several counts will be triggering Arc payments here in Wisconsin and so you can kind of see we're going to see a push up to that 35 billion or more level and that's going to be much higher than we've seen in the past um the last few years so we got some policy questions are out there what's going to happen with um are we going to see trade Wars we'll talk about that this afternoon um

14:19
will the emergency economic assistance count against Arc payments that's my big question you got $10 billion but are you going to get paid for low revenues in 24 for the 24 crop in and receipt that this year are they going to pay you twice for once for an arc payment I I don't see that happening so situation Outlook um crops are down livestock is up overall farming income is down about 6% but we're still above that 20-year average Outlook input costs are down service cost labor is up crop margins look

14:47
really bad for 25 um there's tremendous interest in these Comm policy into 2025 and Beyond so we'll talk about a lot of that this afternoon so thank you [Applause]
 Margin Coverage Option (MCO) for Wisconsin Ag Producers
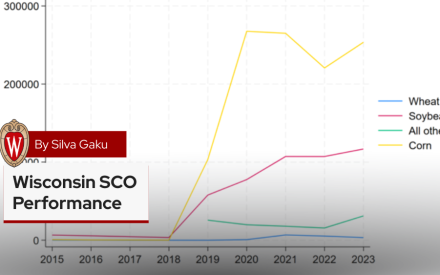 Wisconsin Supplemental Coverage Option (SCO) Performance
 Forage Risk Management in Wisconsin, 2015-2024
 Managing forage production risk with Whole Farm Revenue Protection


