Dairy markets are facing downward price pressures from increased milk production, slower demand, and competition in export markets.
Dairy Herd Trends
The U.S. year-to-date dairy herd has averaged 9.414 million as of August 2023, It is down (-0.14)% from the previous years’ average of 9.4 million, over the same time period.The U.S. had 9.39 million milk cows on farms in August 2023, a decrease of 16,000 head compared to August 2022. Data from the United States Department of Agriculture, National Agricultural Statistics Service (USDA NASS) report shows no change in cow numbers between July 2023 and August 2023.If the same seasonal trends witnessed in previous years persist in 2023, it is possible we will see cow numbers just shy of 9.4 million by the end of year 2023.
The US dairy herd has monthly milk production per cow averaging 2,021lbs for August,2023. This average monthly milk production per cow decreased 1.004% compared to the average of 2,022 lbs per month in August, 2022. For the first eight months of 2023, total U.S. milk production was 18.975 million pounds as of August. This is a 0.004% decrease from the 19.016 million pounds produced over the same time period in 2022. Assuming production trends remain consistent with last year, the estimated total milk production for 2023 is about 227.103 million pounds, a slight increase of 0.0026% compared to 2022.
Fat and Protein Content
The year-to-date average Fat test, according to USDA NASS data, rose from 3.93% in August 2022 to 4.0% in August 2023. This indicates an increase of 0.01% compared to the previous year. Average monthly fat test for 2023 year-to-date has been 4.1%. This is an average monthly increase in percent fat of 0.053 points. During 2023 thus far, the national herd has had an average monthly percent increase in fat of 1.32% over 2022.
Similarly, milk protein test values have been on a year-over-year rise, averaging 3.22% in 2021, 3.25 % in 2022, and estimated to end the year at 3.29% in 2023. In 2022,total production of milk solids was approximately 133,307 billion pounds,0.61% decrease from 2021’s 134,121 billion pounds. In 2023, production of total solids has increased to approximately 133,986 billion pounds, up 0.51% from 2022.
Cold Storage, Inventories and Butter Sales
In recent years, USDA cold storage report of Total Natural Cheese Stocks in All Warehouses has shown a building of inventories in the first seven months of the year. Year end inventory increased 1.93% from 2019 to 2020, 2.86% from 2020 to 2021, and 2.91% from 2021 to 2022.The first seven months of 2023’s inventory has been approximately 0.87% lower compared to the same period last year.
National Dairy Products Sales Report (NDPSR) year-to-date data shows butter sales of 121,619,539 lbs for 2021. Sales increased to 129,535,698 lbs for 2022, a 6.11% increase. As of July 2023, butter sales have totaled 128,487,311 lbs, placing sales currently 1,048,387 lbs behind the same time period last year. USDA NASS Butter Stocks in All Warehouses, has butter inventories decreasing by 32.0 million pounds between June and July 2023. Bringing total inventory to 329 million pounds as of July, 2023. This decline in butter stocks is indicated in figure.10 below.
Milk Supply and Utilization
Data from USDA ERS shows monthly milk supply and utilization, on a M.E. basis. The information in the table below shows year-to-date allocations of milk. Compared to last year, the first six months of 2023 have seen an increase in supply, decrease in exports, increase in ending stocks, and increase in domestic disappearance.
| Year-to-Date Utilization Data on M. E. Fat Basis for Initial Six Months of 2023 | ||||
| Supply(Bil lbs.) | Exports(Mil lbs.) | Ending Stocks(Mil lbs.) | Domestic Disappearance(Mil lbs.) | |
| 2022 | 8,746.50 | 274.8 | 4,092.8 | 4,378.8 |
| % of Total Supply | 3.14% | 46.79 % | 50.06% | |
| 2023 | 8,988.80 | 224 | 4,239.3 | 4, 525.5 |
| % of Total Supply | 1.7 % | 31.6% | 66.7% | |
The United States is a key dairy exporter and is currently facing increased competition from other exporting countries. Global milk production and export statistics for the first half of 2023, as processed by Clal https://www.clal.it/en/?section=prod-export-me-countries , are presented in Figure 13 below. These statistics include exports of cheese, fluid milk, condensed milk, yogurt, SMP, and WMP. New Zealand has the largest increase in exports for the first half of 2023, increasing exports by 1,290 metric tons (M.E) with a production change of +235 metric tons.
The EU-27 follows closely behind with the second largest export increase of 1,127million lbs (M.E.) and an increase of 533 million lbs. of milk production.
The US dairy market is facing a competitive export market, and has seen a decline of 290 million lbs. in export volume. It will be interesting to see how the latter half of 2023 develops.
According to USDA NASS, all-milk price has dropped from $25/cwt in July 2022 to $17.40/cwt in July 2023, before partially recovering to approximately $24.0 in September 2023. Long-term forecasts suggest a potential price recovery in far out months, subject to the resurgence of both domestic and global demand.
Figure 1.
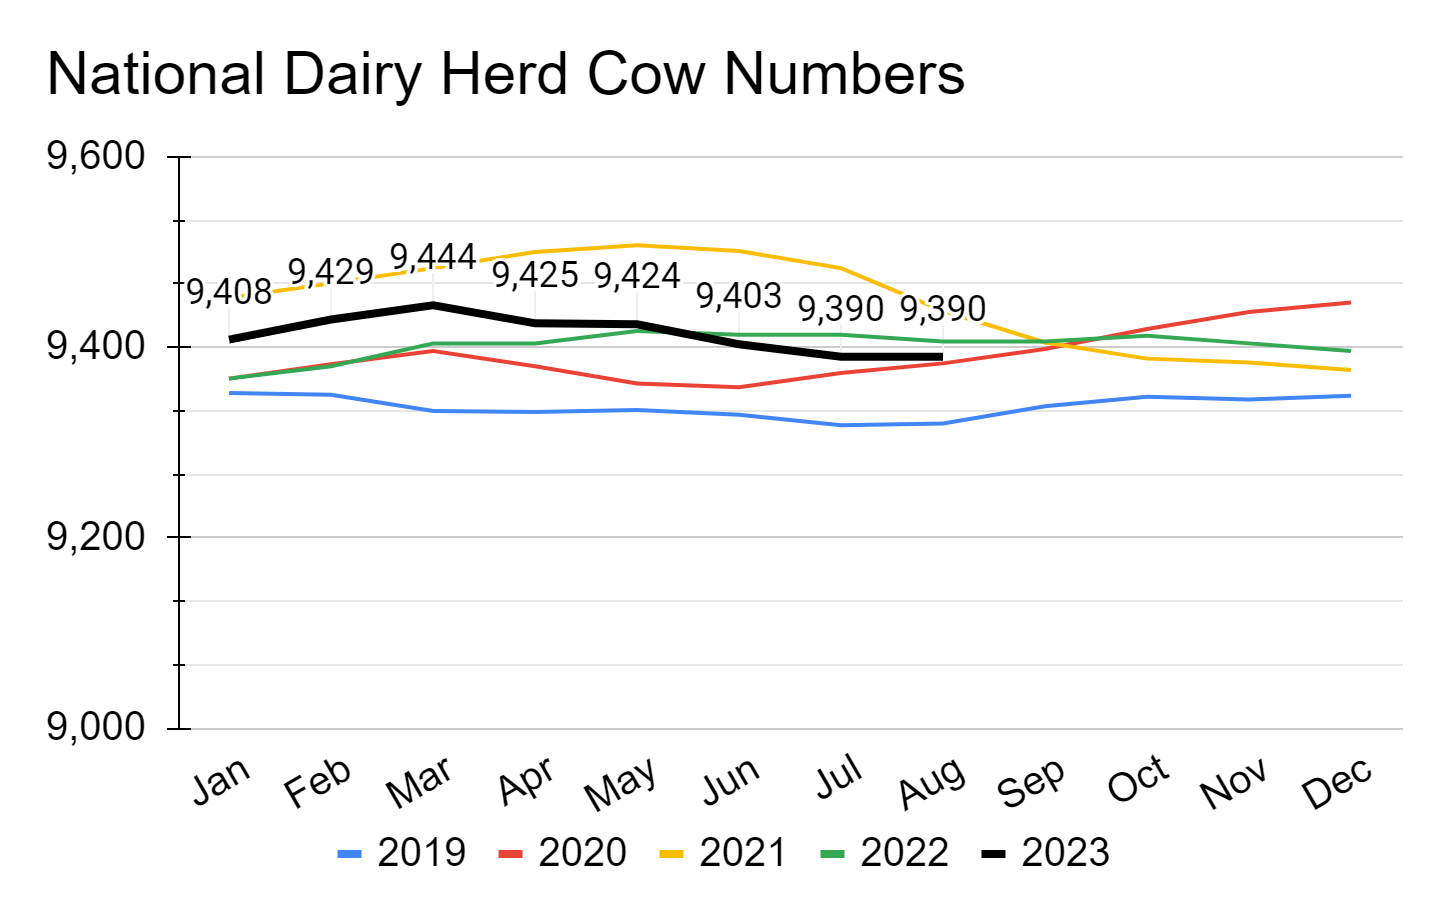
Figure 2.
Figure 3.

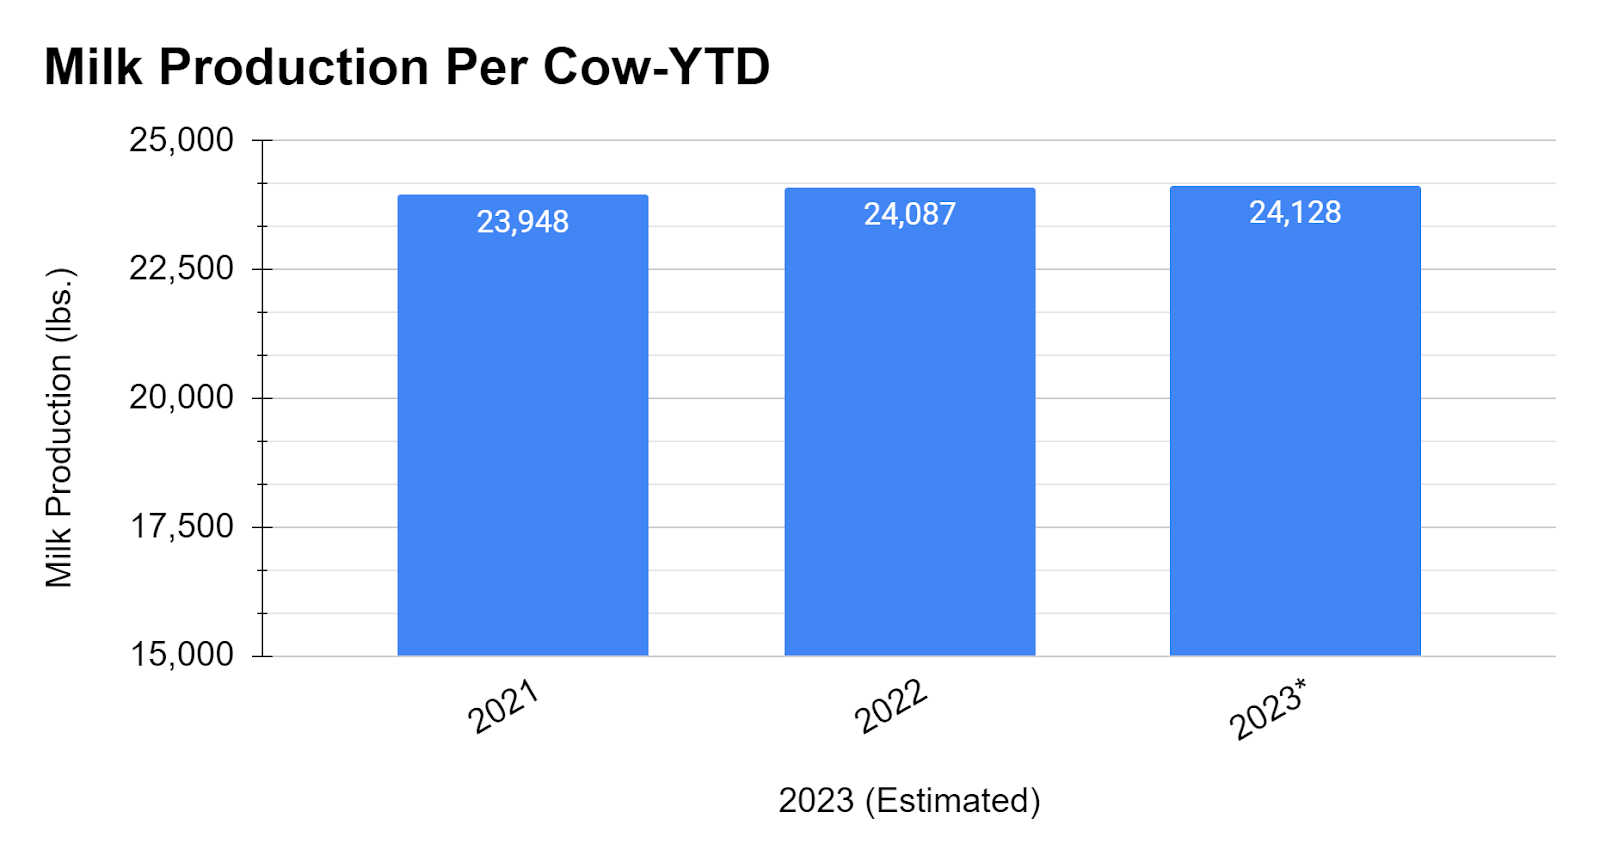
Figure 4.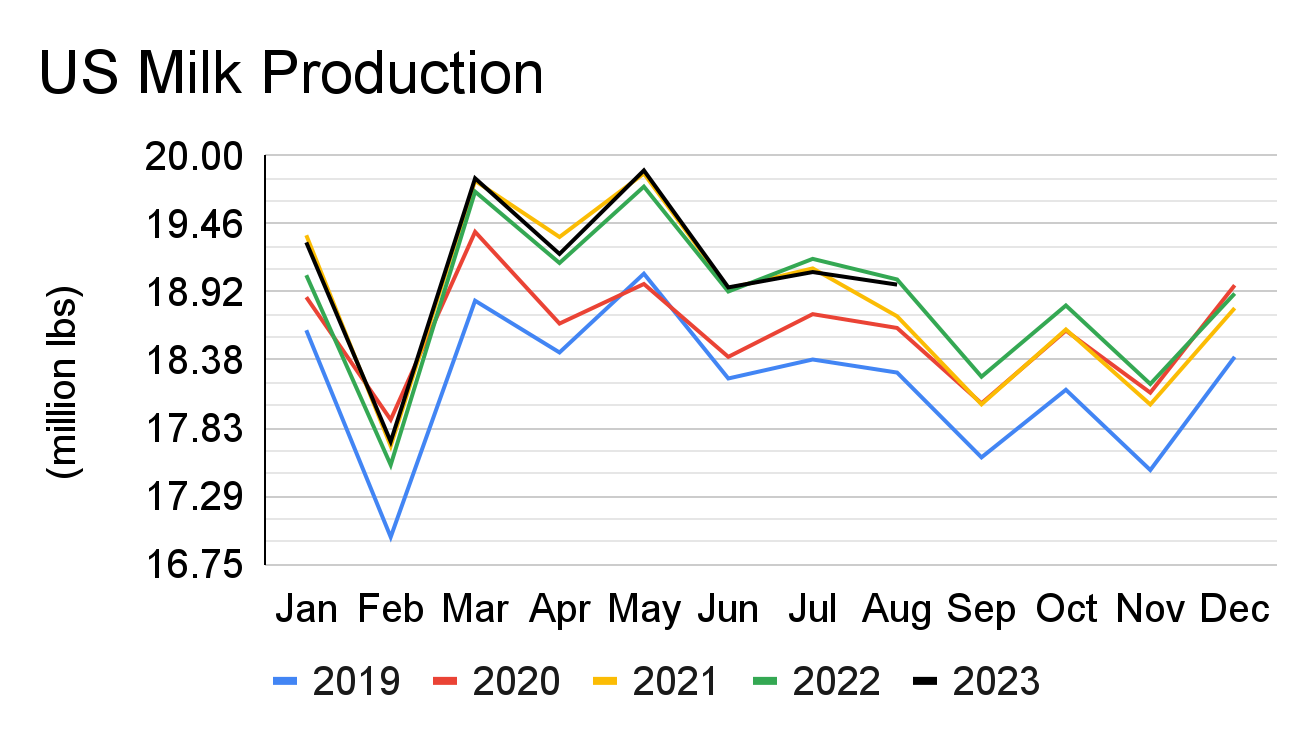

Figure 6.
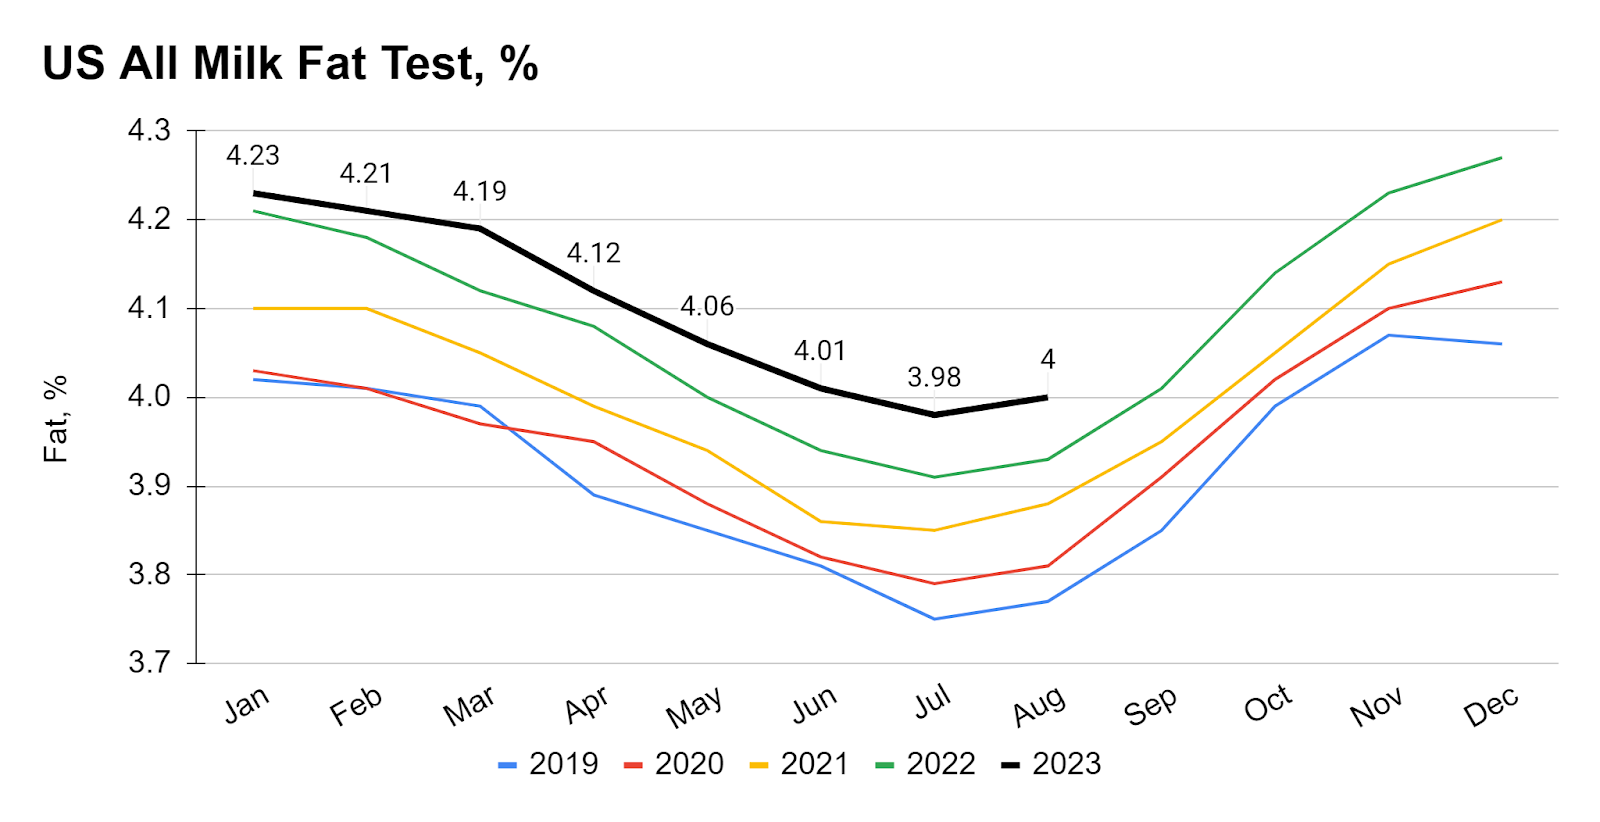
Figure 7.
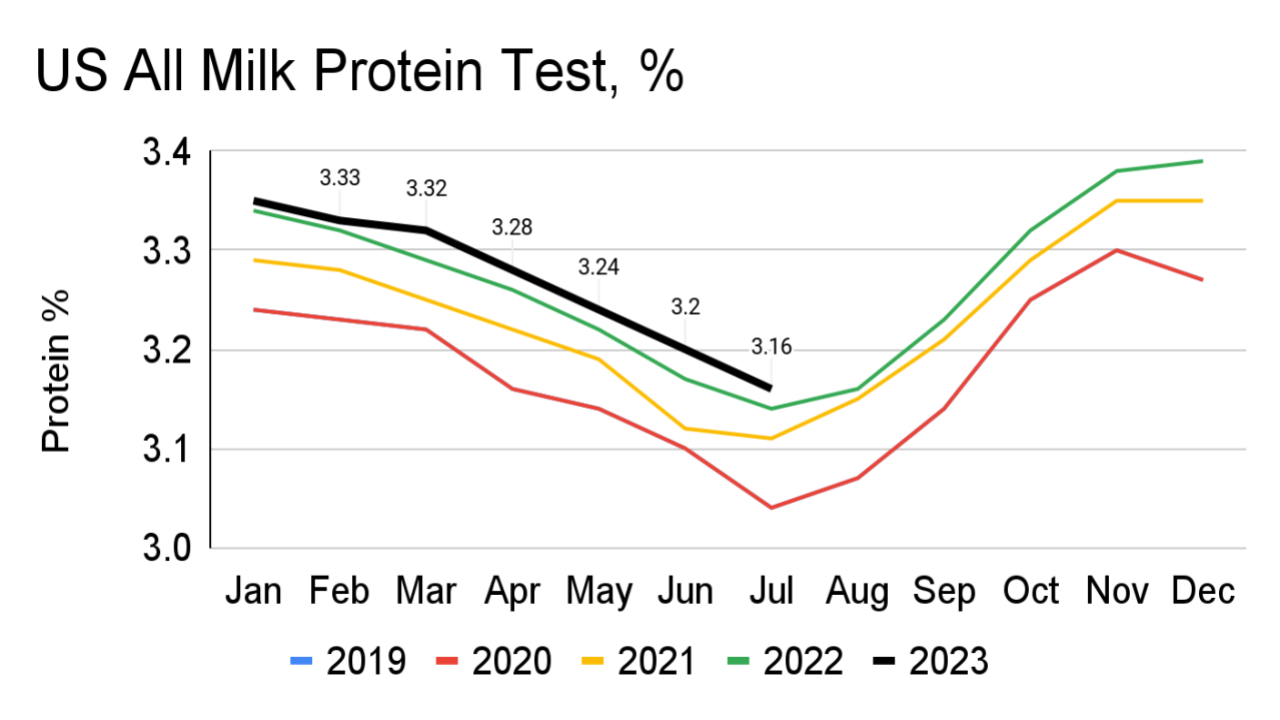
Figure 8.
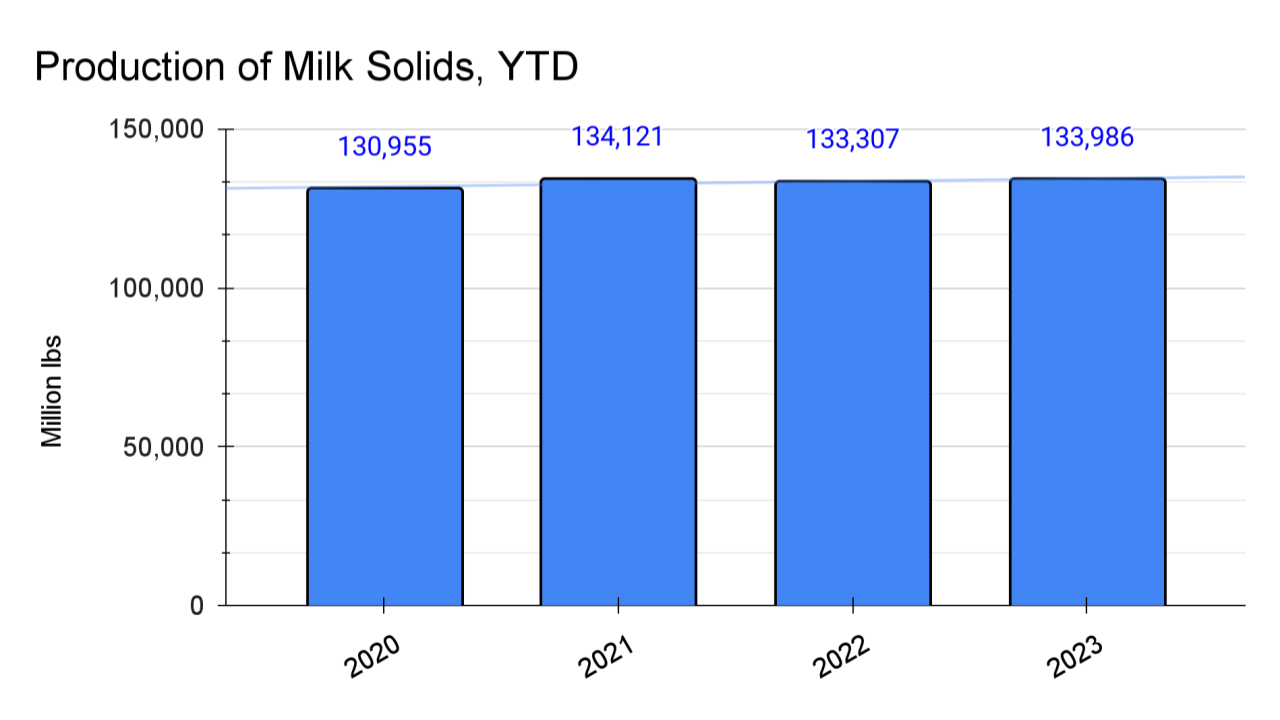
Figure 9.
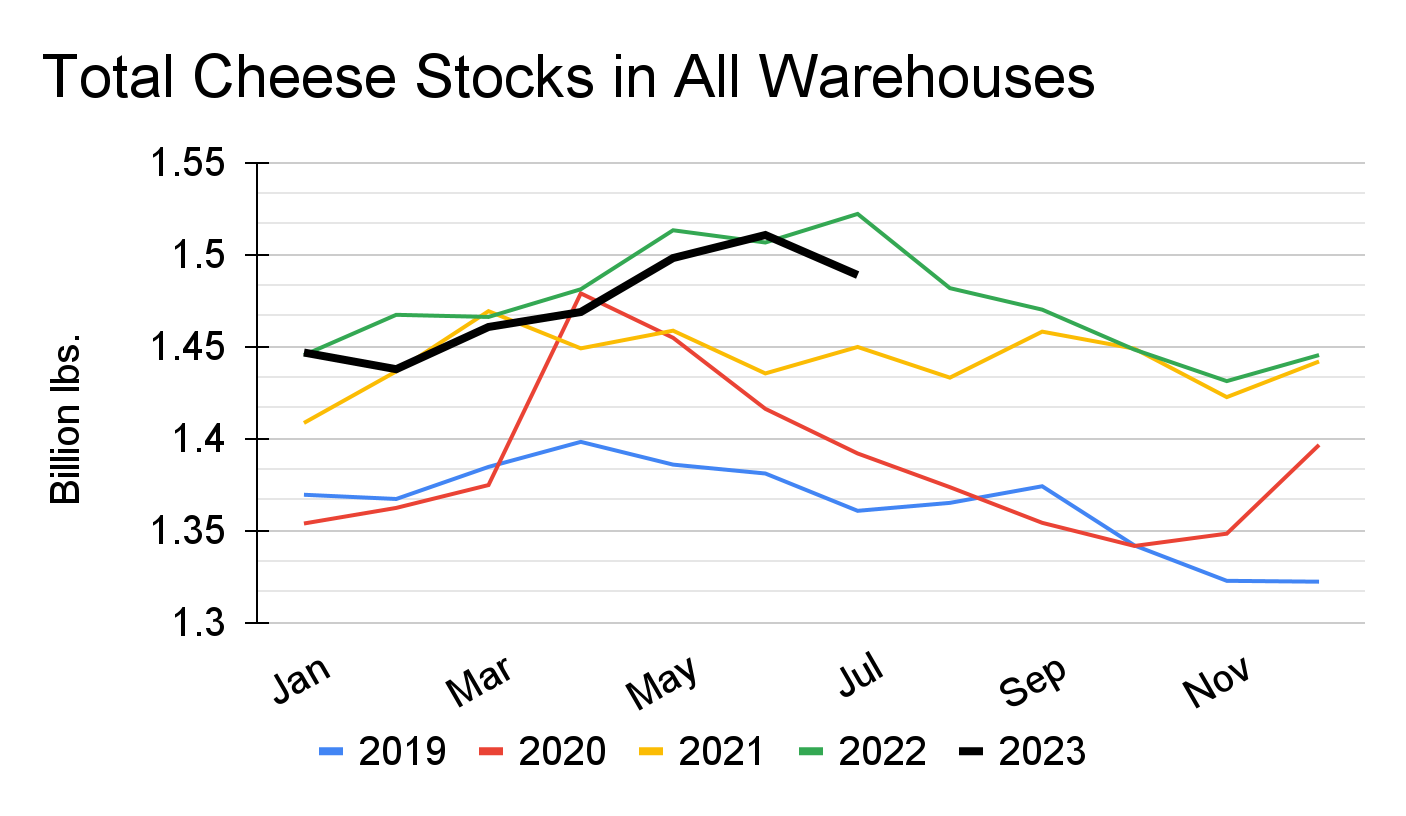
Figure 10.
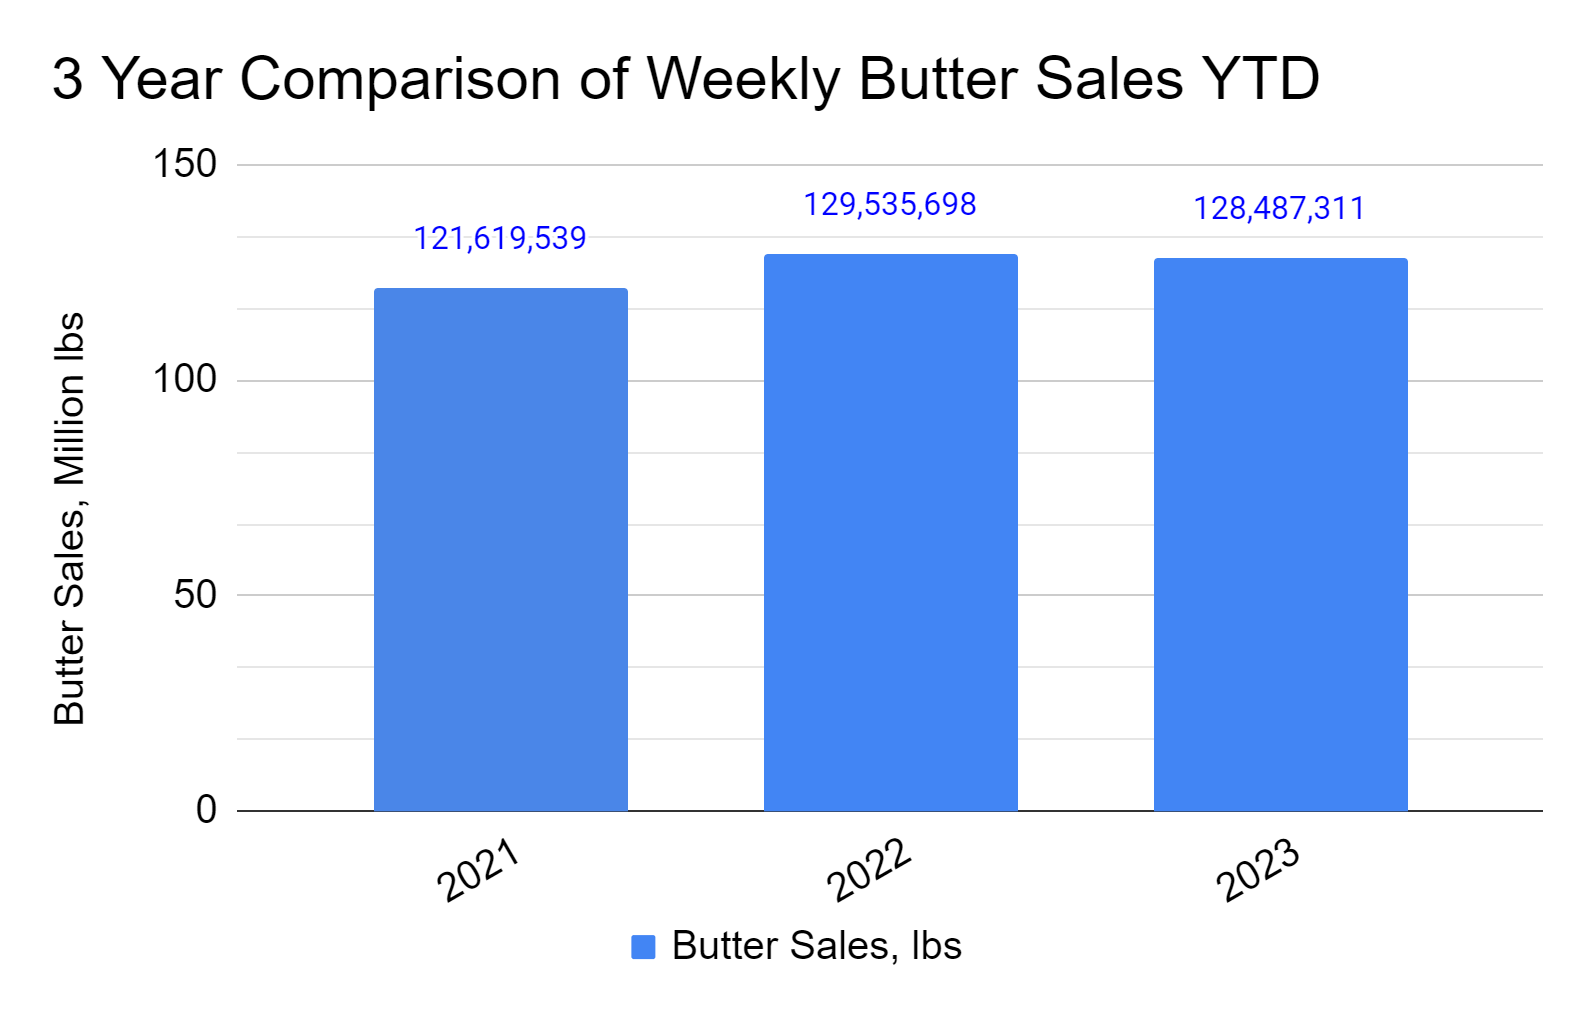
Figure 11.
Figure 12.
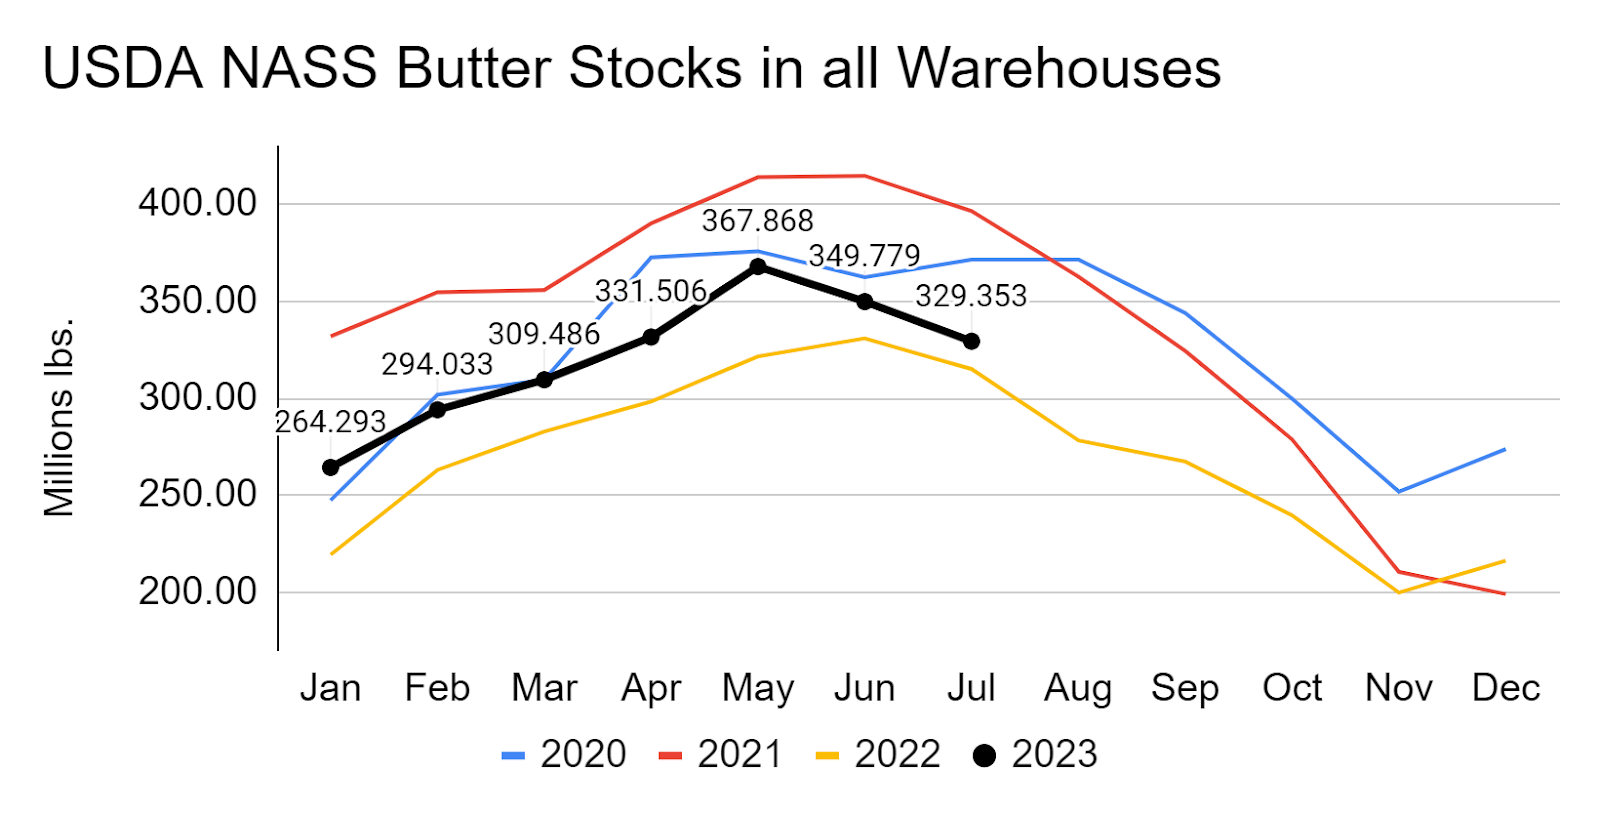
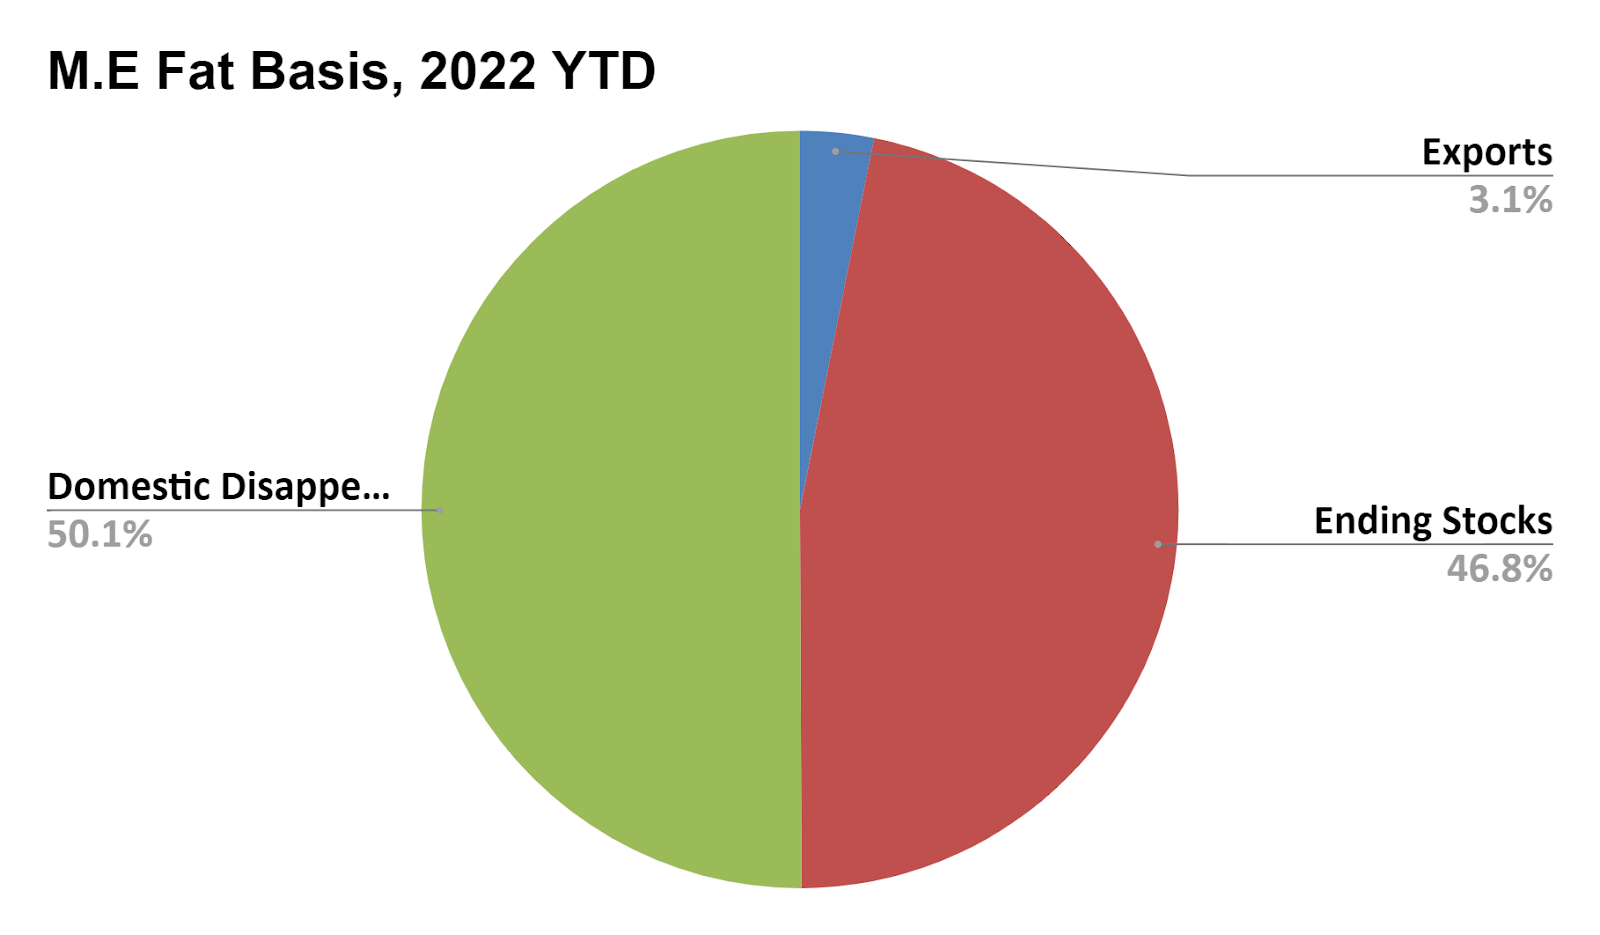
Figure 13
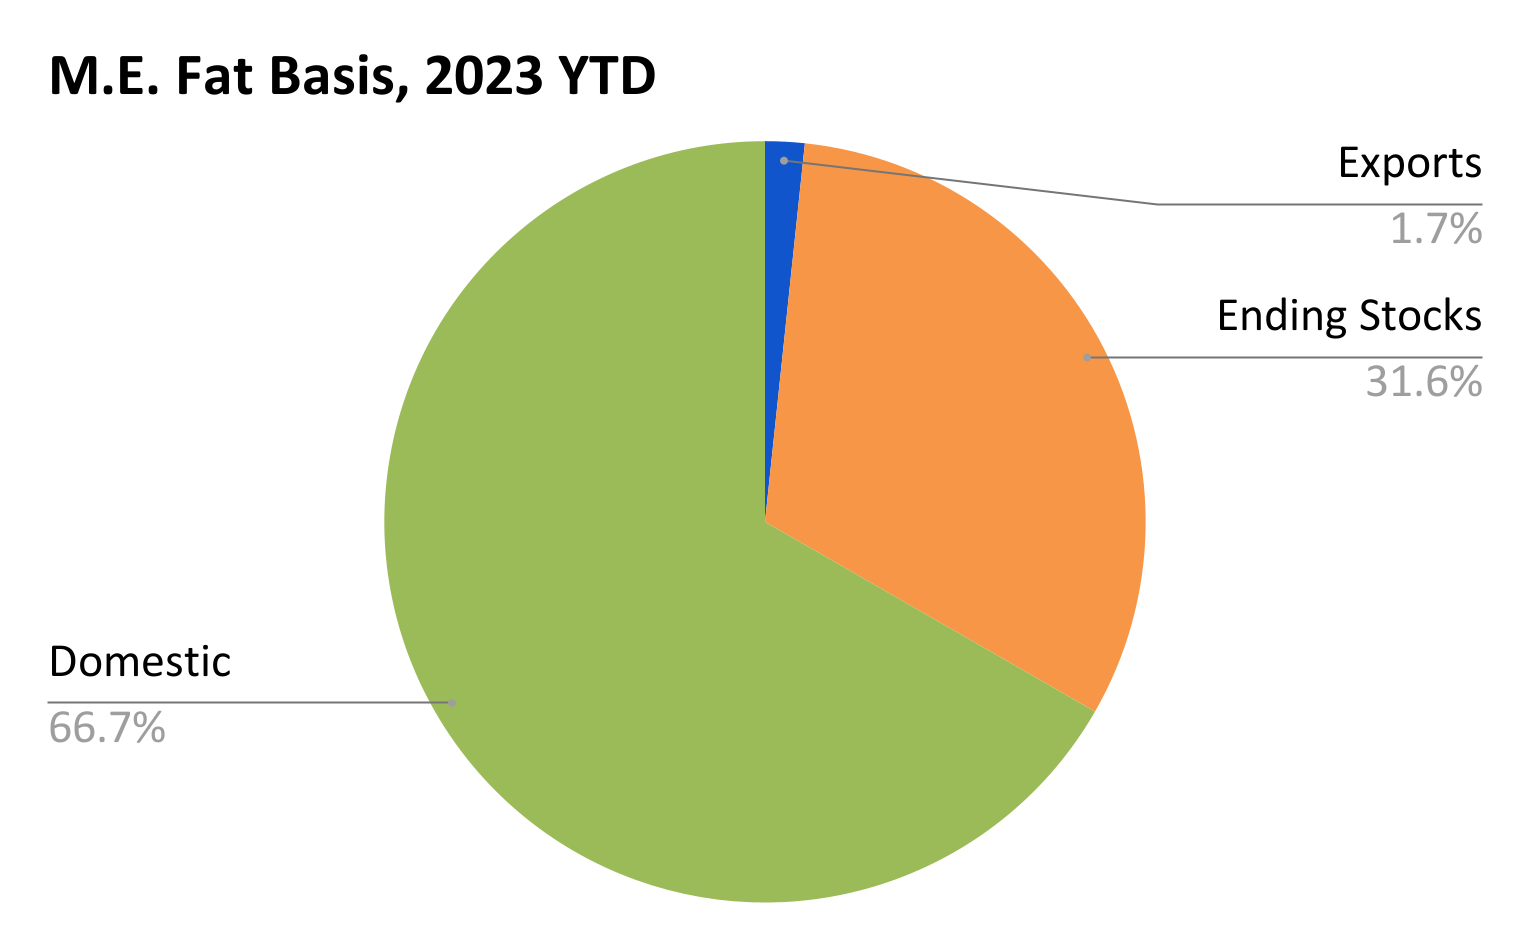
Figure 14.
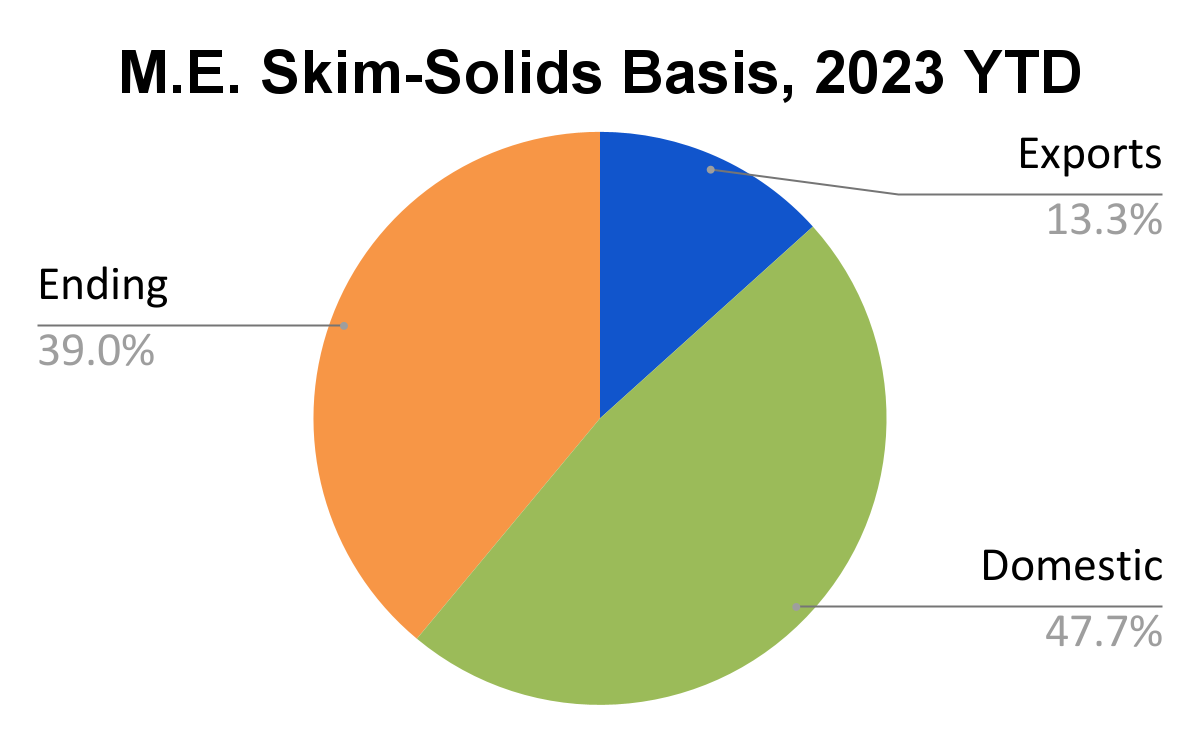
Figure 15.

Figure 16.