There is typically a 3-5% increase in milk and butter sales in the United States during the fall months, compared to the summer period. This rise is largely attributed to the holiday season, with November and December witnessing a significant surge in dairy product purchases.
For example, butter consumption increases by approximately 20% in these months, driven by higher demand for baking and cooking purposes. Cheese sales also see a notable uptick, with a 10-15% increase reported in the fall, correlating with the popularity of cheese in comfort foods and holiday recipes (United States Department of Agriculture). These figures underscore the impact of seasonal trends and holiday traditions on dairy product sales.
Factors Influencing Dairy Prices for 2023-2024: Consumer Trends, Market Indicators, and Anticipated Holiday Demand
The bump in dairy product sales has historically been associated with an increase in fall milk prices. This year the All Milk Price (Figure 1 and Figure 2) seems to be continuing that trend; however, the big question is how much momentum will this seasonality carry prices as we finish 2023 and head into 2024. Will it be enough of a tailwind to keep producers’ ships’ afloat as the calendar changes?
Figure 1.

Figure 2.

There are two main drivers of this question: 1) consumer spending/inflation and 2) timing of product purchases. As markets have been adjusting to post-pandemic times we have been seeing inflation increase as measured by the Consumer Price Index, interest rates rise, personal consumption increasing, credit card debt increase and personal savings rate decline. The convergence of all these factors could be leading consumers to change their spending habits. They may opt for more meals at home or purchase cheaper types of cheese when shopping.
In anticipation of the holiday season, retailers such as grocery stores, place many of their dairy product orders in September. This buying action can act as a barometer of anticipated demand. This year, September buying did not see as much strength as many would have liked. While not a perfect indicator, it is an indicator nonetheless and it brings forth the question of upward price momentum as we look forward to the first few months of 2024. Will there be enough support to hold up the post-holiday slump normally witnessed in December and February?
Analysis of Domestic Butter and American Cheese Consumption Trends: Seasonal Patterns and Growth Factors
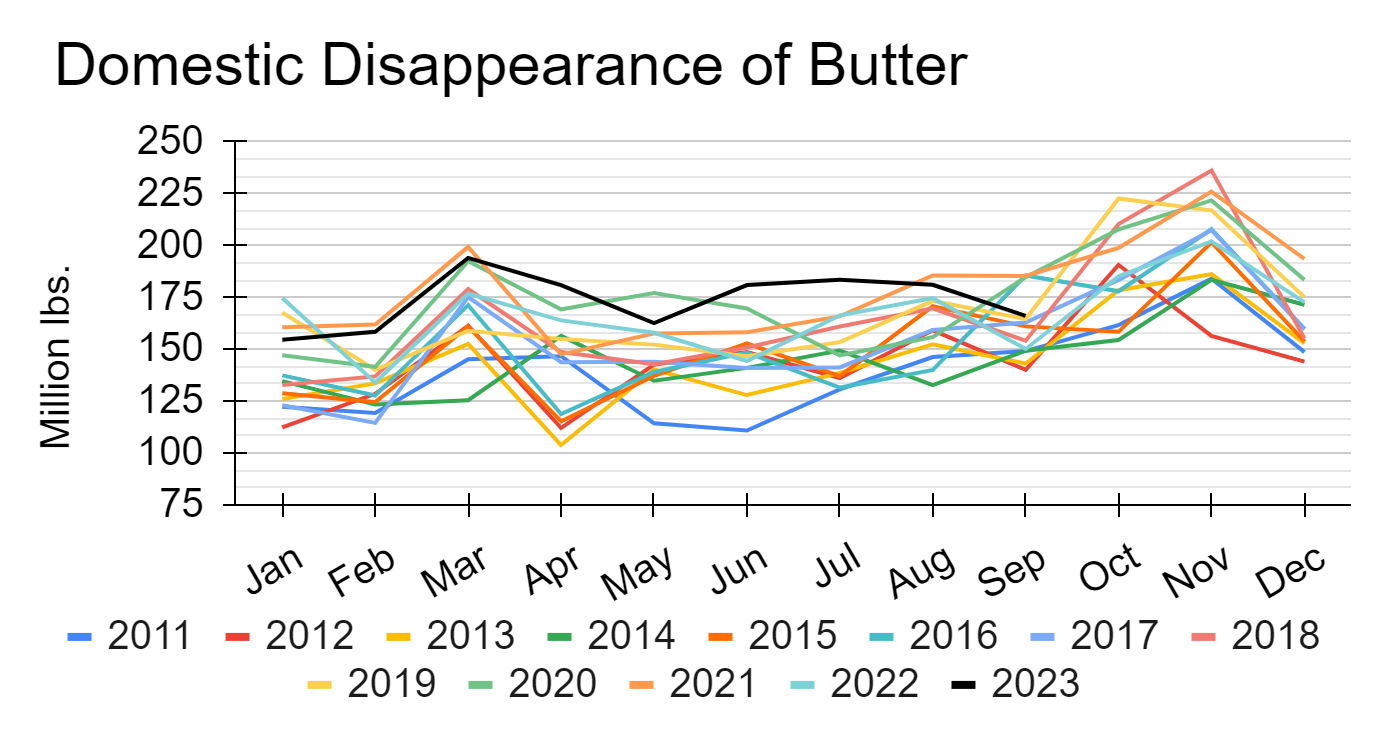
Domestically, commercial disappearance of butter continues to outpace historical consumption (figure 3).
Domestic disappearance refers to the total quantity of a product that is used, consumed, or disappears within a country during a specific period of time.
Data from 2011 to 2023 shows domestic disappearance of butter historically increases in the latter half of the year. The highest rates of domestic butter disappearence generally occurs in November. The highest month over this time period is November 2018, which reached a monthly high of 236.2 million pounds. 2023 has stood out from previous years in that domestic disappearance has generally been stronger than normal for most of the year.
Figure 3.
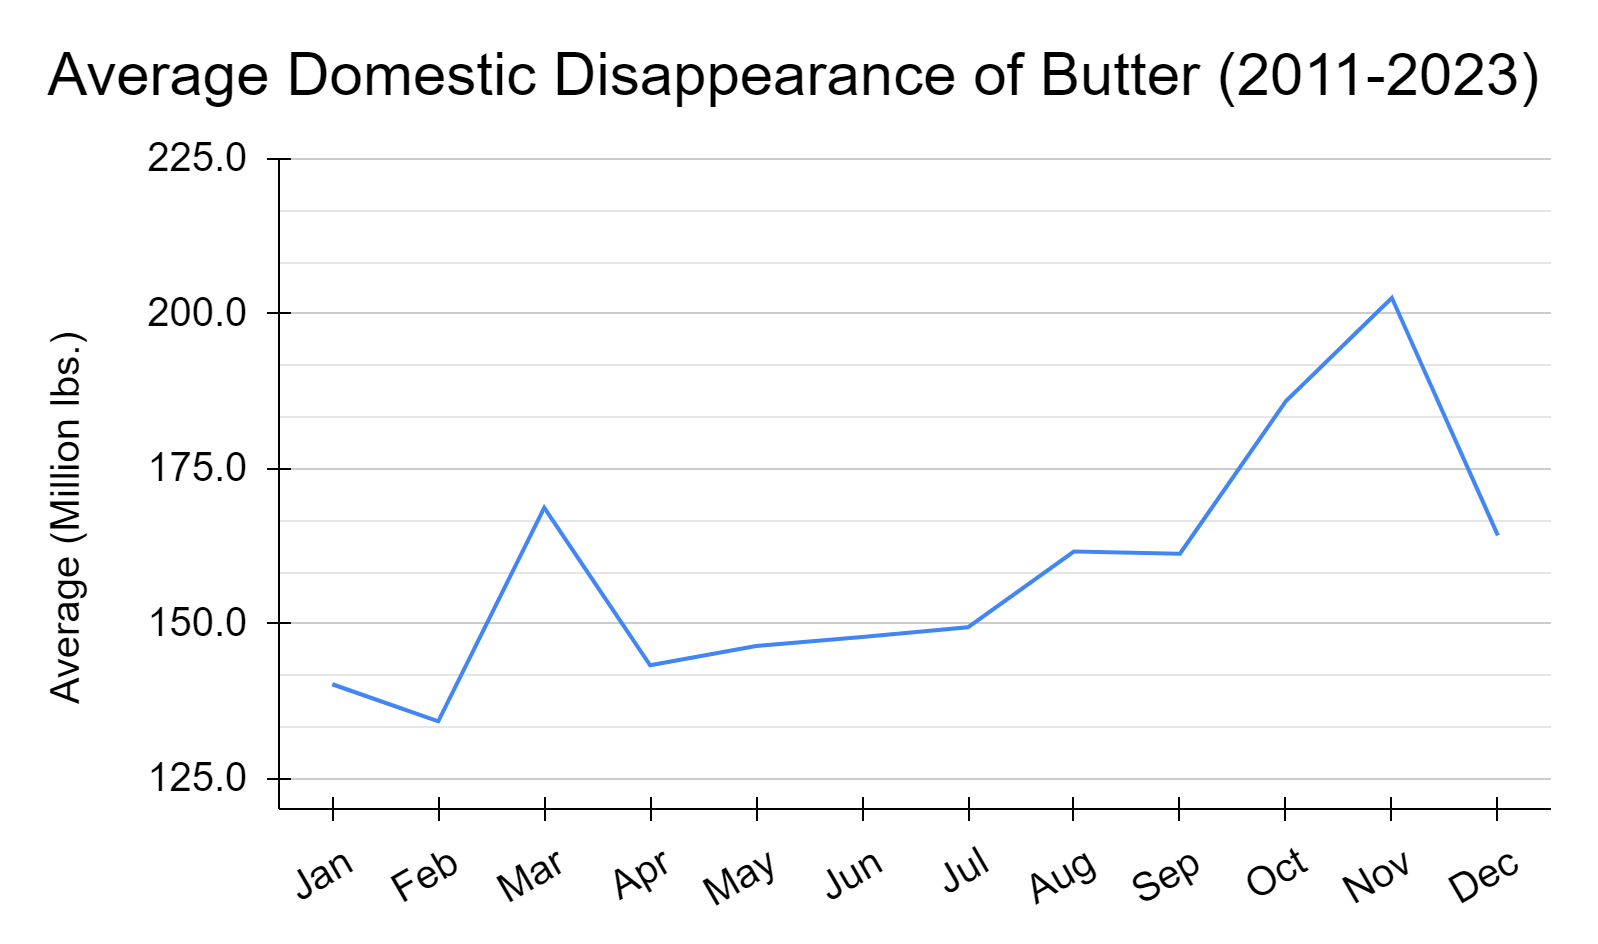
For the last 12 years, the month of November has topped the chart averaging 202.5 million pounds cleared from the market, ushering in a December dip which has averaged 164.3 million pounds, as depicted in figure 4.
Figure 4.
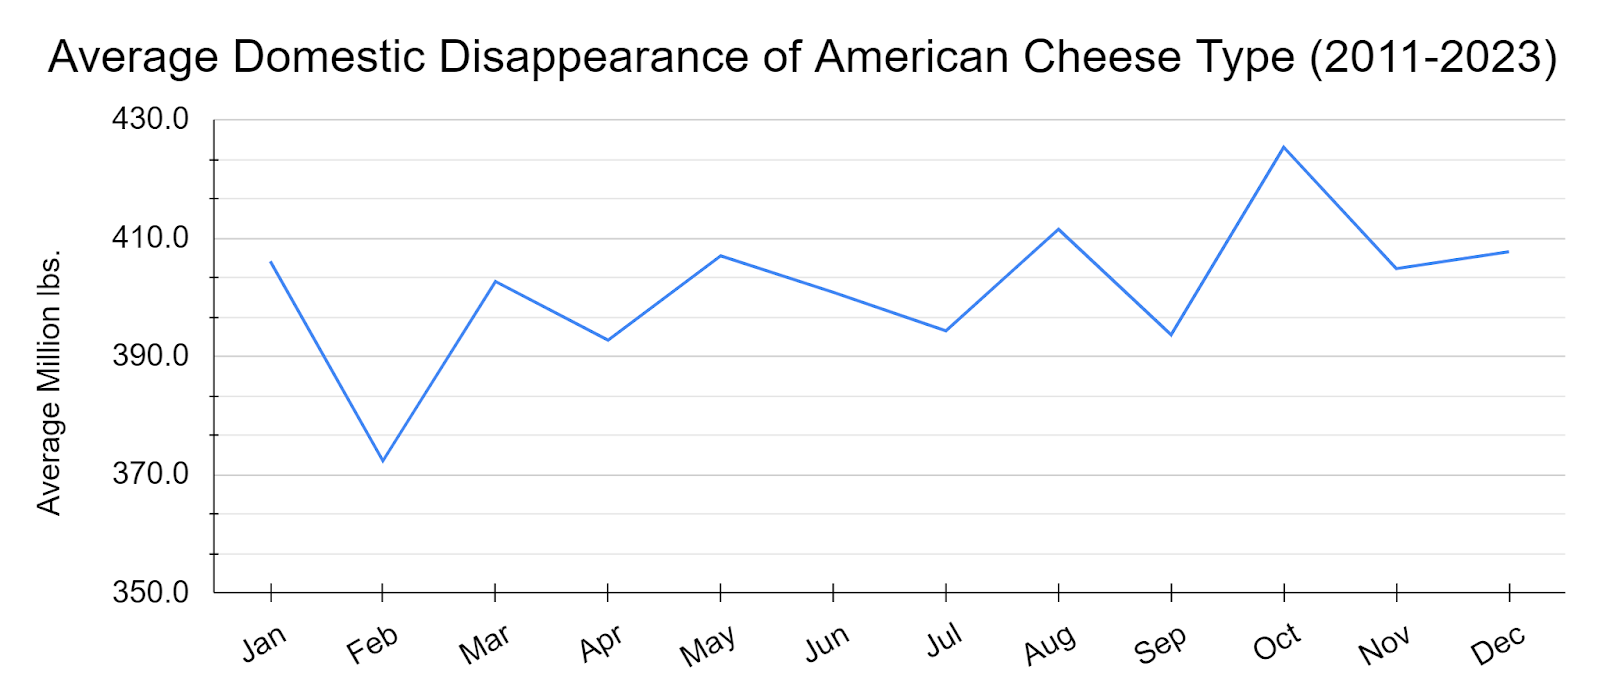
Similar to butter, there has been a general increase in the domestic disappearance of American cheese over the same 12-year period and seasonal peak in the fall of the year (figure 5 and figure 6). US domestic cheese consumption has been increasing, in January of 2011 domestic disappearance of American cheese was 339.1 million pounds and in January of 2023, it was approximately 480.9 million pounds. This increase in demand has allowed for expansion in milk production and processing capacity. Coupled with this growth is the dairy industries’ need for US citizens to continue making these purchasing decisions.
Figure 5.
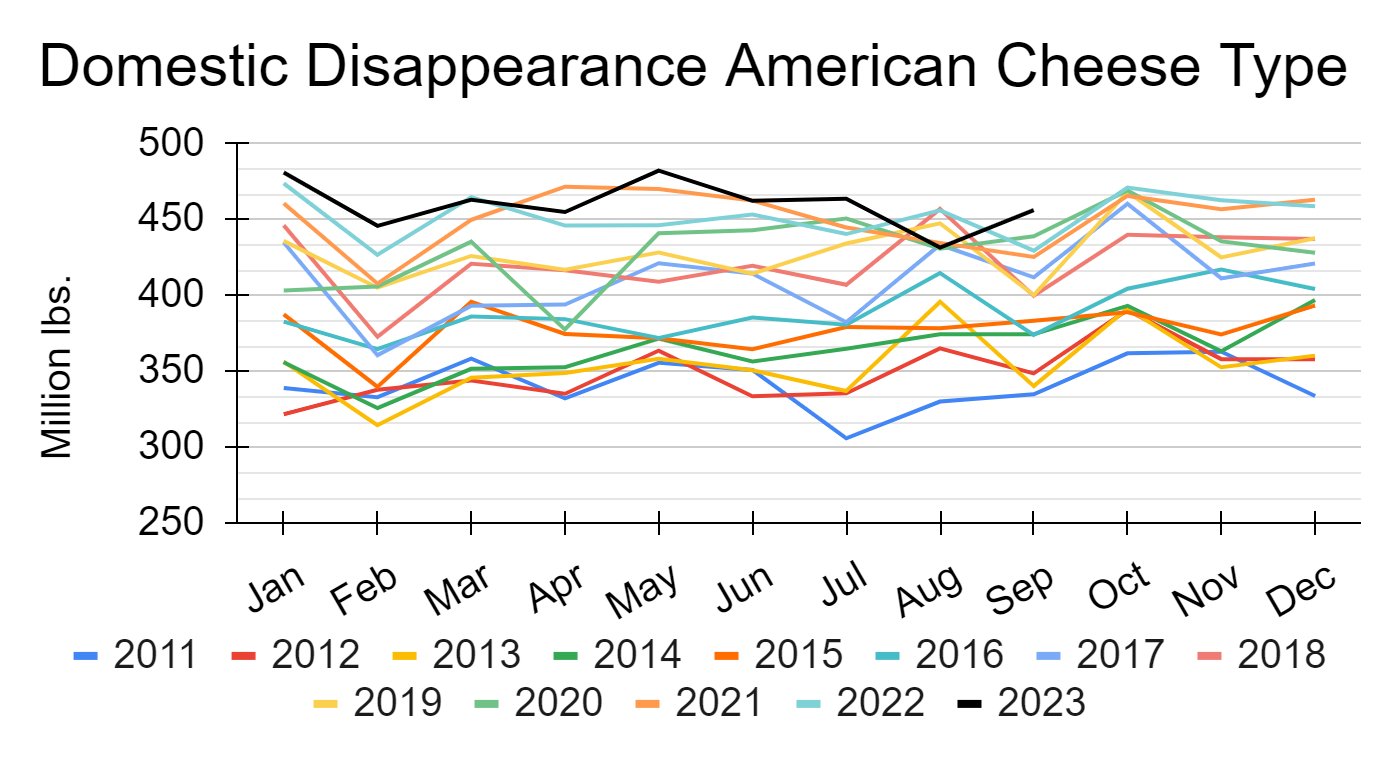
Figure 6.
Impact of US Consumer Spending on Dairy Market Prices: Trends, Comparisons, and Holiday Projections
The prices in the dairy market are sensitive to changes in US consumer spending, given that approximately 89% of milk on a milkfat basis and 74% of milk on a skim-solids basis is consumed domestically. Dairy product inflation has been a mixed bag when looking across the product category. Fluid milk is starting to look like a buy relative to other products when grocery shoppers are pursuing the shelves, while butter has remained comparably expensive. As a product category, dairy’s CPI (figure 7) has fared well compared to All Food, Food Away From Home and Food at Home . It has remained below all three of the other CPI metrics and has shown slower rates of increase.
Figure 7.

The National Retail Federation (NRF) anticipates an increase in 2023 holiday spending, with projections of a 3% to 4% year-over-year rise for the months of November and December. This estimation, however, is not adjusted for inflation and is aggregated over product categories. Given the unadjusted nature of this forecast, the actual increase in consumer spending is potentially overstated. The data from the National Retail Federation indicates that a majority of consumers place increased emphasis on the value of sales and promotions. This trend (figure 8) could influence the dairy market as consumers opt for more affordable options or only buy higher-end dairy products when there are sales or promotions.
Figure 8.
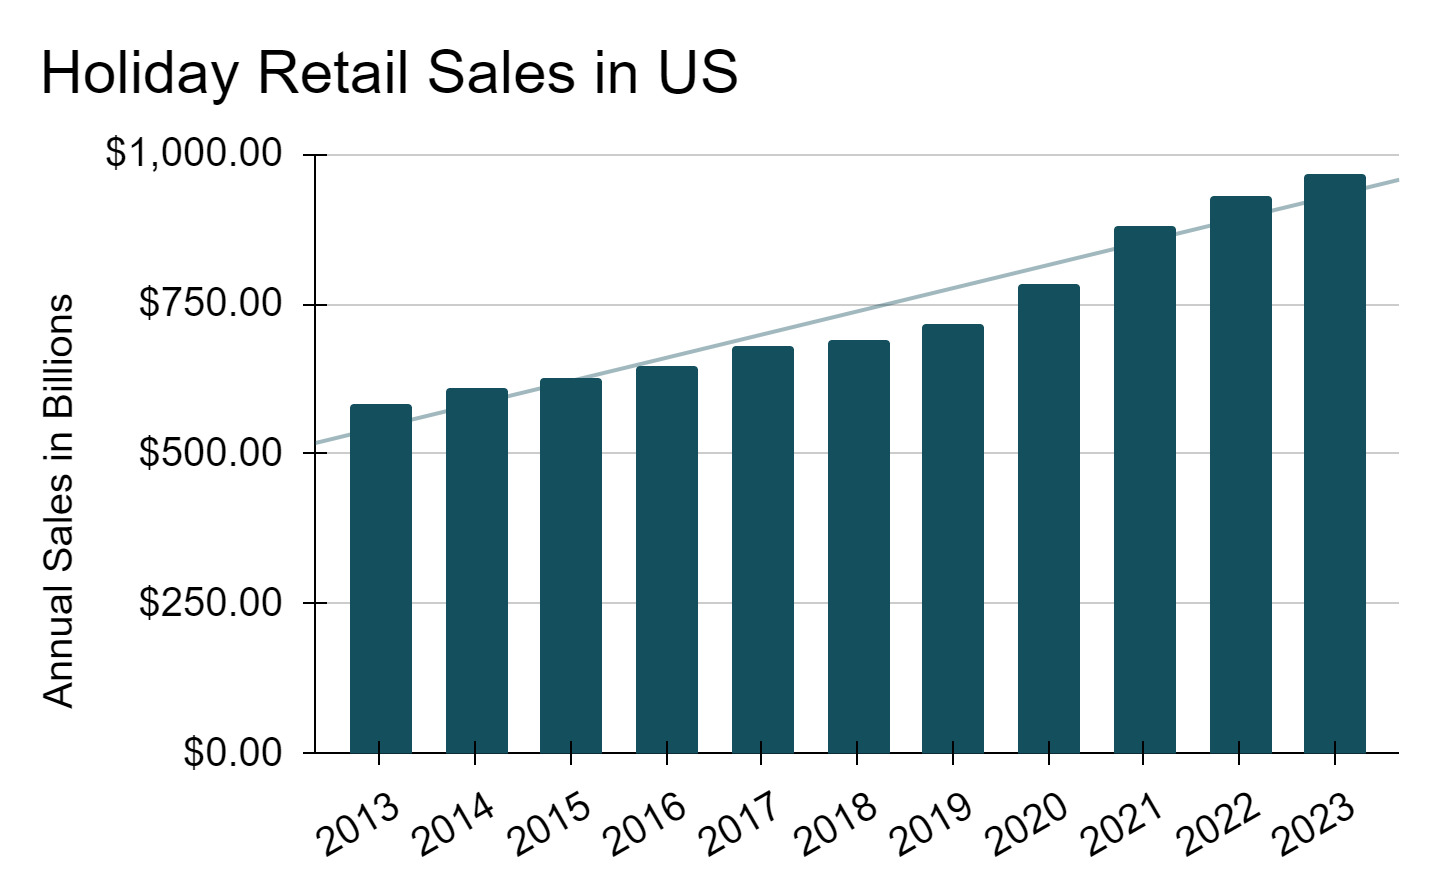
Additional information on historical holiday sales shown in figures 8 and 9 are compiled in table 1. This is based on key figures and expectations regarding holiday sales and associated economic indicators as reported by the National Retail Federation (NRF) and other referenced sources. The detailed information can be reached at https://nrf.com/media-center/press-releases/2023-holiday-reach-record-spending-levels
Figure 9.
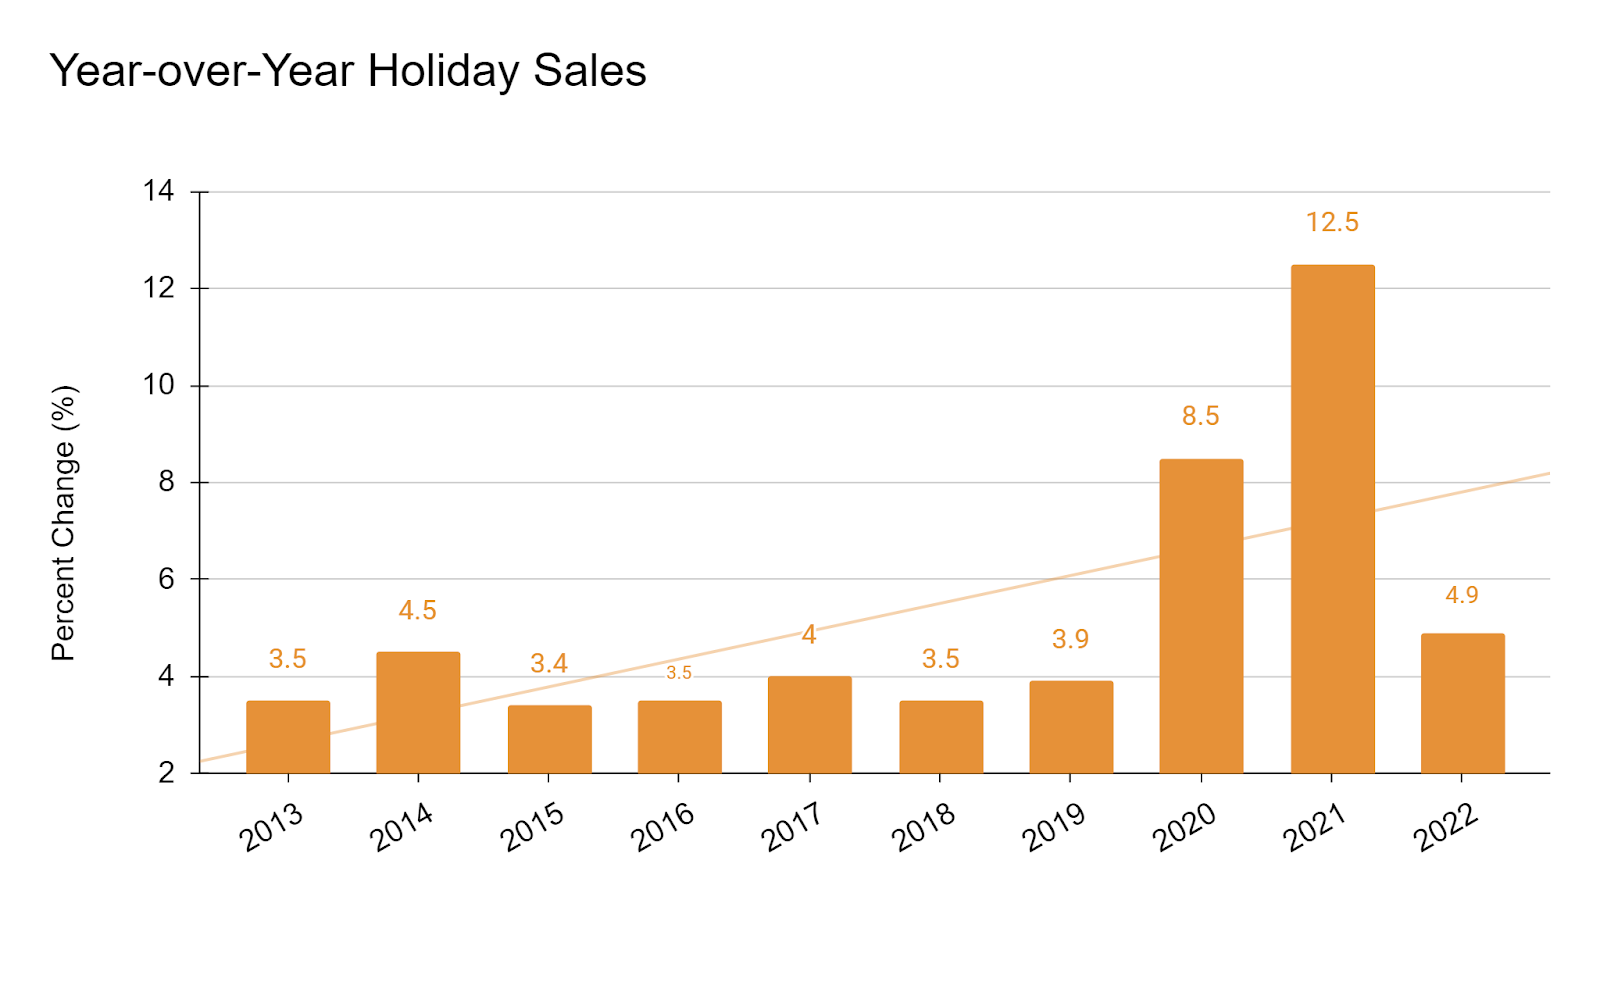
| Table1. Summary of NRF Holiday Sales Projections | |
|---|---|
| Category | Information |
| Sales Growth Forecast | 3% – 4% year over year for Nov-Dec |
| Projected Spending | $957.3 billion to $966.6 billion in holiday season |
| Forecast Exclusions | Automobile dealers, gasoline stations, restaurants |
| Decade Average Growth | 5% per year on average |
| Growth During Covid Pandemic | 9.3% in 2020, 13.5% in 2021 |
| Pre-pandemic Average Growth | 3.6% from 2010 to 2019 |
| Factors Influencing Forecast | Low unemployment, cooling inflation, dwindling savings, higher mortgage & credit card costs |
| Inflation Rate (as of September) | 3.7% year over year increase (Bureau of Labor Statistics) |
| Inflation (excluding gas & food) | 0.5% to 1% higher than a year ago |
| Sales Gain Context | Not adjusted for inflation |
| Inflation for Retail & Food | Up 1.3% year over year based on personal consumption expenditures price index |
| Previous Year Sales Increase | 5.3% compared with previous year |
| Previous Year Total Sales | $936.3 billion |
| Forecast Accuracy Previous Year | Forecast was 6% to 8% growth, actual was 5.3% |
| Consumer Spending Plan | $875 on average on holiday items |
| Average Increase in Spending Plan | 5.3% compared with the previous year |
The key takeaway from the National Retail Federation is their anticipation of increased holiday spending. When thinking about dairy products clearing the market, this expectation should be balanced with the signs of:
- Rising personal debt levels.
- Declining personal savings rates.
- Inflationary pressures, especially on gifts and food, as they could drive consumers to prioritize value and discounts.
- Spending may not indicate a true increase in economic well-being but rather a trend toward credit-reliant purchases.
- The rise in credit card debt and use of savings for consumption suggests an unsustainable financial situation for consumers.
- Consumers have responded to inflation through dissaving, a temporary solution that could potentially exacerbate a longer-term problem.
Assessing Consumer Spending Impact on Dairy Sales: CPI Trends, Inflation, and Potential Market Implications for 2024
Based on the numbers alone, dairy’s CPI metrics paint a relatively favorable picture for domestic sales and the apparent increase in consumer spending could translate into an increase of dairy product sales. The question remains, if consumers do spend more dollars, does this mean they are purchasing greater quantities?.
The Bureau of Labor Statistics reported a 3.7% rise in inflation as of September. This information, when paired with the commercial buying of dairy products being reportedly weaker than expected for September, might mean the product does not clear the shelves at the pace many in the industry would like.
There is a concern that spending might not meet the expectations of the dairy industry, which often relies on heightened demand during this time to bolster prices. If spending falls short, it could lead to price pressure in the first quarter of 2024. This is especially pertinent considering the low milk prices experienced in 2023 and the historical trend of milk prices dipping in the first few months of each calendar year. Analyzing the holiday spending data will be important in setting expectations and preparing for potential market adjustments in the dairy sector as we transition into 2024.
Consumer spending during this holiday season may also provide valuable insights into the state of the American household, particularly in understanding how the recent convergence of market changes is impacting them. Once all the holiday spending and consumption data are in the books, they will help set the tone and shape expectations for the first quarter of 2024.