In this article, we provide a historical examination of forage risk management programs available in Wisconsin from 2015 to 2024.
Dairy and livestock producers rely heavily on forage production, which is the primary source of nutrition and is essential for maintaining animal health and productivity. However, the quality and availability of forage is highly dependent on receiving sufficient and timely rainfall. Weather conditions, including drought, excessive heat and unseasonal dry spells, can significantly reduce forage yields, leading to feed shortages and increased production costs.
To help producers manage the risks associated with forage production, several insurance and support programs are available to Wisconsin producers. These include the Forage Seeding Program, which provides coverage for newly established forage crops against losses due to adverse weather conditions and damage from wildlife, insects and plant disease; the Forage Production Program, designed to protect against yield losses in established forage stands; and the Pasture, Rangeland, and Forage (PRF) Insurance Program, administered by the USDA’s Risk Management Agency (RMA). The PRF program helps mitigate risks associated with insufficient rainfall by providing coverage based on a rainfall index, offering producers a safety net when precipitation falls below historical averages.
Over the 2015–2024 period, forage insurance programs show varied performance in Wisconsin. Forage Production and Forage Seeding insurance generally provided higher indemnities than premiums paid, except in 2016 and 2024. In contrast, PRF insurance often showed lower program loss ratios, with indemnities frequently falling short of premiums. Indemnities per insured acre varied widely across programs, highlighting differences in payout patterns. Given the substantial subsidies—ranging from 51% to 59% for PRF and 38% to 67% for Forage Production and Seeding—participation in these programs should be a carefully considered, strategic decision. Wisconsin producers have generally benefited from these policies, which tend to pay more in indemnities relative to premiums over time.
PRF triggers payout to producers when precipitation in a producer’s grid is lower than the insured coverage level. With premium subsidies ranging from 51 to 59 percent, producers can insure 70 percent to 90 percent of their grid. Both Forage Production and Seeding have premium subsidies ranging from 38 percent to 67 percent, and they triggered payouts to producers when covered losses occur.
From 2015 to 2024, Wisconsin producers paid $61 million in Forage Production premiums and received $53 million in indemnities. Indemnities relative to program premiums range from 0.2 in 2024 to 2.76 in 2019; however, producer loss ratio ranges from 0.54 in 2024 to 7.34. Except in 2016 and 2024, producers tend to receive more in indemnities payments than premiums incurred. Indemnities ranges from $7 in 2016 to $57 per insured acre in 2023. In the same period, Wisconsin producers paid over $19 million in Forage Seeding premiums and received $30 million in indemnities. Indemnities tend to be greater than producer (program) premiums, except in 2024 when the ratio is 0.69 (0.31). Indemnities per insured acre ranges from $9 in 2024 to $101 in 2018. From 2015 to 2024, Wisconsin producers who enrolled in PRF paid more than $18 million in premiums, while receiving approximately $10 million in indemnities. Program loss ratios tend to be lower than 1, ranging from 0.08 in 2019 to 1.05 in 2023. Due to premium subsidies, the probability of producer loss being equal or greater than 1 is the same as it being below 1. Indemnities relative to producer premium is lowest in 2016 with 0.19 and highest in 2023 with 2.27. Per acre indemnities for producers who enrolled in PRF ranges from $3 in 2016 to $37 in 2023.
Table 1. Forage Production, 2015-2024
| Year | Insured Acres | Policies Sold | Total Premium | Subsidy | Indemnity | Producer Loss Ratio | Program Loss Ratio | Indemnity per acre |
|---|---|---|---|---|---|---|---|---|
| 2015 | 329,934 | 3,039 | 8,611,586 | 5,353,050 | 7,031,176 | 2.16 | 0.82 | 21.31 |
| 2016 | 273,134 | 2,381 | 6,777,070 | 4,204,885 | 1,849,419 | 0.72 | 0.27 | 6.77 |
| 2017 | 220,885 | 1,920 | 3,817,072 | 2,354,626 | 5,326,533 | 3.64 | 1.4 | 24.11 |
| 2018 | 194,409 | 1,684 | 3,493,762 | 2,136,330 | 4,770,705 | 3.51 | 1.37 | 24.54 |
| 2019 | 162,008 | 1,468 | 3,203,622 | 1,997,630 | 8,846,511 | 7.34 | 2.76 | 54.61 |
| 2020 | 151,766 | 1,370 | 4,283,939 | 2,614,286 | 7,031,068 | 4.21 | 1.64 | 46.33 |
| 2021 | 188,256 | 1,340 | 6,429,633 | 3,891,042 | 3,273,395 | 1.29 | 0.51 | 17.39 |
| 2022 | 187,929 | 1,367 | 8,545,408 | 5,184,763 | 3,911,103 | 1.16 | 0.46 | 20.81 |
| 2023 | 166,025 | 1,287 | 8,625,909 | 5,243,632 | 9,533,870 | 2.82 | 1.11 | 57.42 |
| 2024 | 151,291 | 1,156 | 7,216,201 | 4,523,248 | 1,440,881 | 0.54 | 0.2 | 9.52 |
Table 2. Forage Seeding, 2015-2024
| Year | Insured Acres | Policies Sold | Total Premium ($) | Subsidy ($) | Indemnity ($) | Producer Loss Ratio | Program Loss Ratio | Indemnity per acre |
|---|---|---|---|---|---|---|---|---|
| 2015 | 95,858 | 2,990 | 2,315,302 | 1,333,029 | 2,385,746 | 2.43 | 1.03 | 24.89 |
| 2016 | 68,190 | 2,939 | 1,622,340 | 940,330 | 3,627,413 | 5.32 | 2.24 | 53.20 |
| 2017 | 70,015 | 2,848 | 1,574,305 | 913,272 | 2,000,938 | 3.03 | 1.27 | 28.58 |
| 2018 | 72,905 | 2,798 | 1,696,914 | 974,765 | 7,384,586 | 10.23 | 4.35 | 101.29 |
| 2019 | 74,115 | 2,865 | 1,621,168 | 916,514 | 4,024,793 | 5.71 | 2.48 | 54.30 |
| 2020 | 129,307 | 3,044 | 3,110,898 | 1,757,349 | 4,257,939 | 3.15 | 1.37 | 32.93 |
| 2021 | 84,105 | 3,153 | 2,021,408 | 1,130,454 | 2,452,191 | 2.75 | 1.21 | 29.16 |
| 2022 | 53,997 | 3,067 | 1,313,798 | 735,140 | 1,439,729 | 2.49 | 1.1 | 26.66 |
| 2023 | 74,654 | 2,978 | 2,128,618 | 1,189,489 | 2,226,318 | 2.37 | 1.05 | 29.82 |
| 2024 | 68,137 | 3,054 | 2011,768 | 1112,676 | 623375 | 0.69 | 0.31 | 9.15 |
Table 3. PRF, 2015-2024
| Year | Insured Acres | Policies Sold | Total Premium ($) | Subsidy ($) | Indemnity ($) | Producer Loss Ratio | Program Loss Ratio | Indemnity per acre |
|---|---|---|---|---|---|---|---|---|
| 2015 | 52,416 | 427 | 2,058,346 | 1,102,773 | 843,856 | 0.88 | 0.41 | 16.10 |
| 2016 | 60,242 | 476 | 2,149,767 | 1,162,517 | 188,403 | 0.19 | 0.09 | 3.13 |
| 2017 | 54,946 | 431 | 1,628,921 | 879,492 | 662,532 | 0.88 | 0.41 | 12.06 |
| 2018 | 50,071 | 403 | 1,628,250 | 873,311 | 663,552 | 0.88 | 0.41 | 13.25 |
| 2019 | 49,434 | 379 | 1,772,578 | 949,486 | 136,976 | 0.17 | 0.08 | 2.77 |
| 2020 | 42,869 | 328 | 1,486,183 | 796,280 | 691,509 | 1 | 0.47 | 16.13 |
| 2021 | 49,929 | 344 | 1,718,390 | 923,065 | 1,509,346 | 1.9 | 0.88 | 30.23 |
| 2022 | 49,313 | 362 | 1,742,149 | 935,172 | 1,460,396 | 1.81 | 0.84 | 29.61 |
| 2023 | 54,608 | 408 | 1,928,303 | 1,035,506 | 2,022,615 | 2.27 | 1.05 | 37.04 |
| 2024 | 65,637 | 462 | 2,220,244 | 1,196,264 | 1,729,360 | 1.69 | 0.78 | 26.35 |
In Figures 1-3, we present aggregate producer loss ratio from 2015-2024 across Wisconsin counties. For all three programs, the aggregate producer loss ratio exceeded one, indicating indemnities received surpassed the premiums paid in most counties.
Figure 1. Forage Production Producer Loss Ratio, 2015-2024

Figure 2. Forage Seeding Producer Loss Ratio, 2015-2024
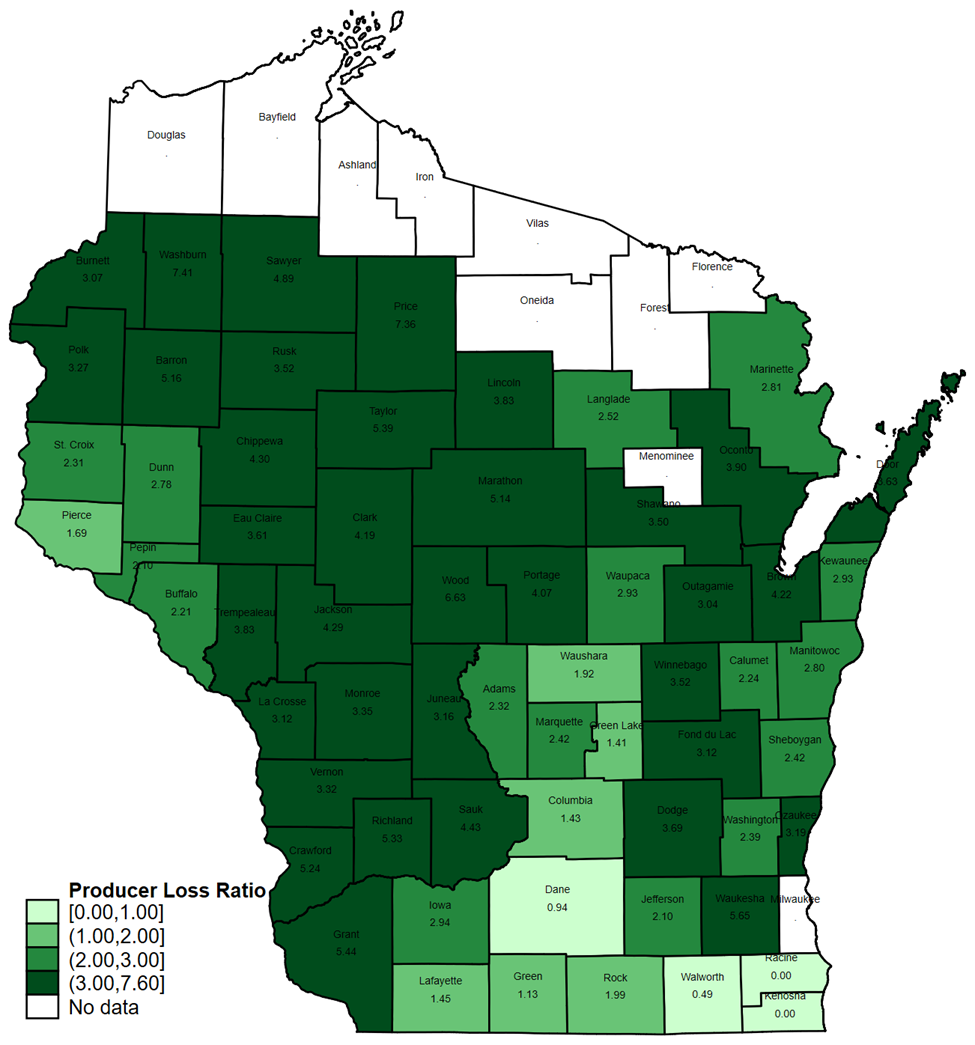
Figure 3. PRF Producer Loss Ratio, 2015-2024

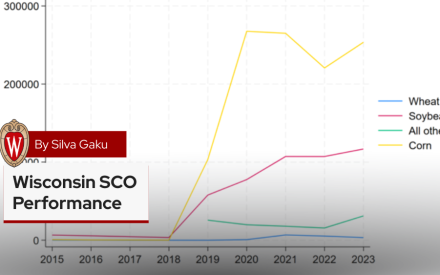
Producers tend to receive more indemnities for every $1 of premium incurred; however, participation in these programs remain low in Wisconsin. In 2024, Wisconsin producers enrolled 151000, 68000 and 66000 respectively in Forage Production, Forage Seeding and PRF.
Figure 4. Participation in Forage Risk Management, 1989-2024

Despite low participation in forage risk management, enrollments in these forage risk management program vary greatly across counties as shown in Figures 5-7. Enrollment in forage production tend to concentrate in northeastern counties of Wisconsin in 2024. The participation in forage seeding follows the pattern observed for forage production, but enrollment by a collection of southern and western counties is high. PRF participation in 2024 tend to concentrate in western counties.
Figure 5. Forage Production Insured Acres, 2024
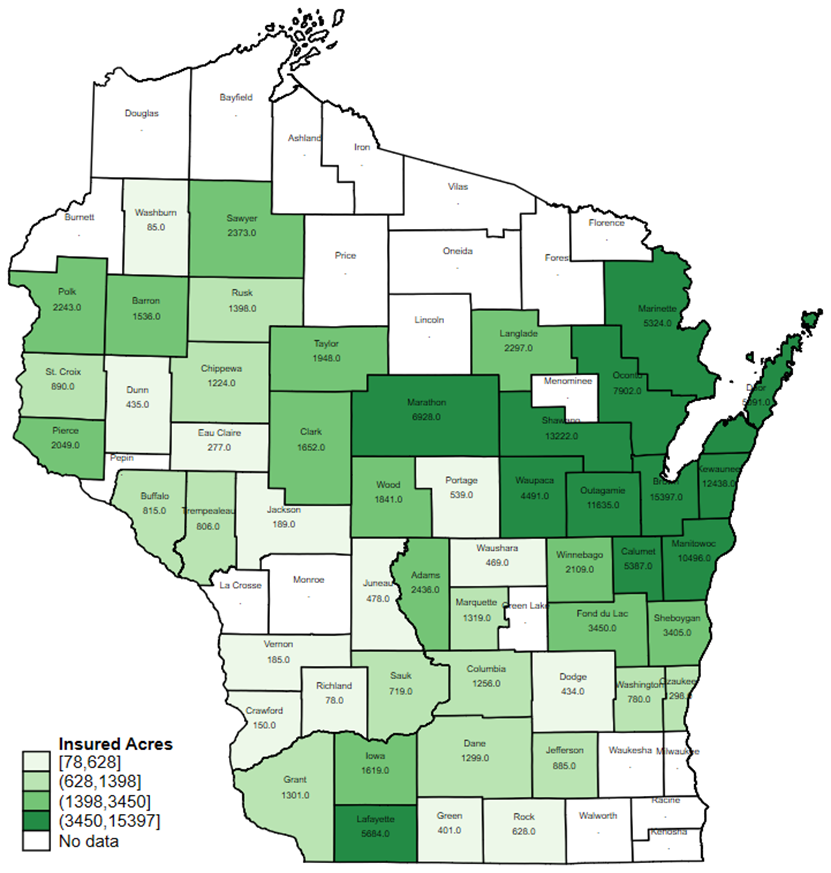
Figure 6. Forage Seeding Insured Acres, 2024
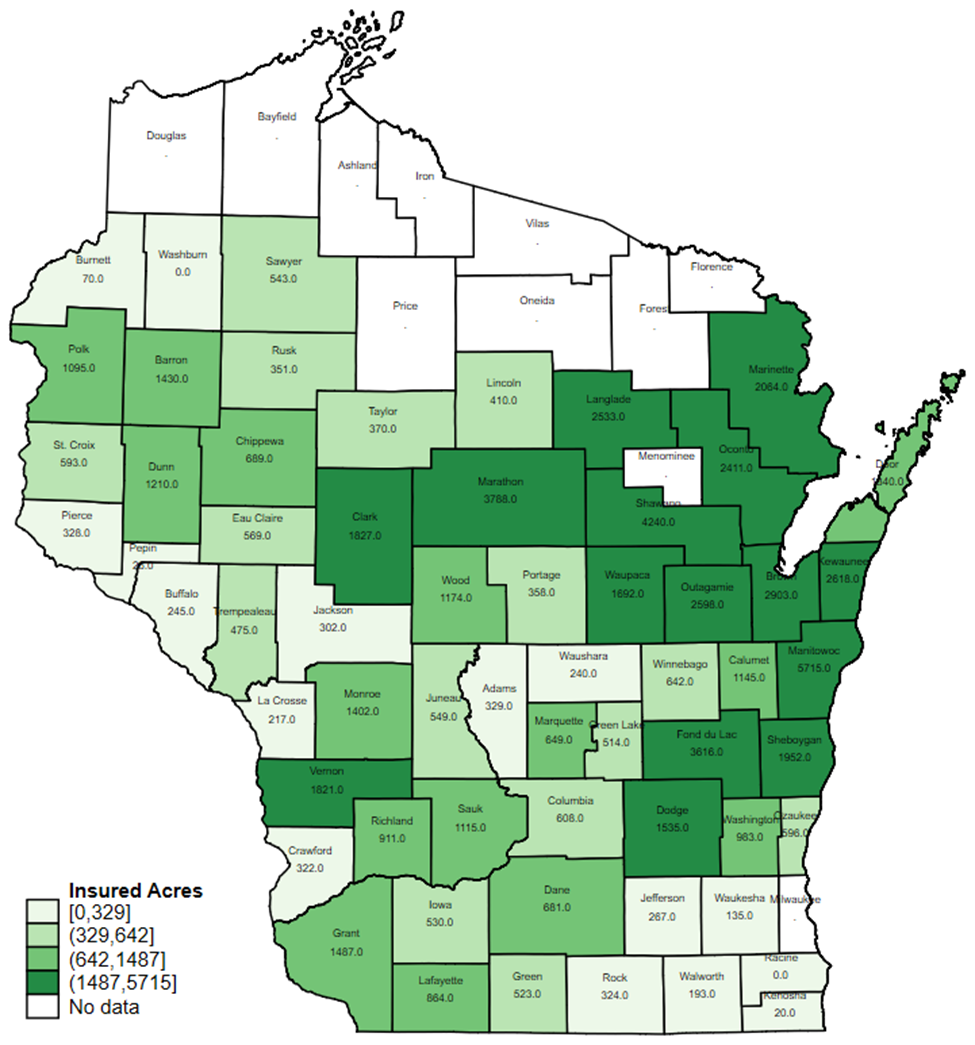
Figure 7: PRF Insured Acres, 2024

Over the 2015–2024 period, forage insurance programs show varied performance in Wisconsin. Forage Production and Forage Seeding insurance generally provided higher indemnities than premiums paid, except in 2016 and 2024. In contrast, PRF insurance often showed lower program loss ratios, with indemnities frequently falling short of premiums. Indemnities per insured acre varied widely across programs, highlighting differences in payout patterns. Given the substantial subsidies—ranging from 51% to 59% for PRF and 38% to 67% for Forage Production and Seeding—participation in these programs should be a carefully considered, strategic decision. Wisconsin producers have generally benefited from these policies, which tend to pay more in indemnities relative to premiums over time.
References:
USDA, Agricultural Research Service. (2012, March). What is forage? U.S. Dairy Forage Research Center. Retrieved March 4, 2025, from https://www.ars.usda.gov/ARSUserFiles/50901500/EducationalMaterialsMarch2012/Especially%20For%20Teachers/01_what%20is%20forage_v2.pdf
Parsons, J., Hewlett, J., & Tranel, J. (2023, November 10). Pasture, Rangeland, Forage Insurance summary of sales and performance history. Center for Agricultural Profitability, University of Nebraska–Lincoln. https://cap.unl.edu/news/pasture-rangeland-forage-insurance-summary-sales-and-performance-history/
U.S. Department of Agriculture, Agricultural Research Service. (n.d.). U.S. Dairy Forage Research Center. U.S. Department of Agriculture. Retrieved March 4, 2025, from https://www.ars.usda.gov/midwest-area/madison-wi/us-dairy-forage-research-center/