Introduction
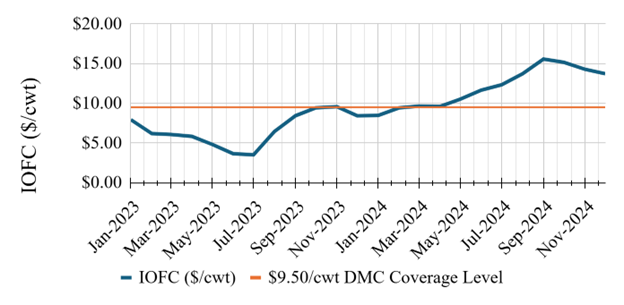
The dairy markets in 2023 and 2024 have shown us once again how fast and far the pendulum of profitability can swing. Income over feed costs (IOFC) reached historic lows in 2023, only to rebound in early 2024, marking a $12.05 per hundredweight (cwt) swing from top to bottom in 14 months. Entering 2025, dairy prices have remained stable to weaker. While there appears to be more bearish than bullish fundamental factors present, the magnitude of these influences remains uncertain. The extent of each factor’s impact will ultimately determine farm-level profitability in the coming year.
On the bullish side, expanded dairy processing capacity is increasing demand for milk, while high beef prices have bolstered that revenue stream for producers. Beef prices have encouraged optimization of herd management and dairy replacement inventory. Arguably, the greatest bearish factors at the beginning of 2025 are policy uncertainties, such as potential tariffs, reductions in food assistance programs, and shifts in immigration and labor policies. Additionally, as new dairy processing facilities become operational in 2025, the market must absorb eventual increased product availability, which could pressure prices downward. Furthermore, anticipated Federal Milk Marketing Order (FMMO) reforms, set to take effect in 2025, are expected to decrease the All Milk Price by approximately $0.30/cwt, with a more pronounced impact on Class III prices.
Bullish Market Drivers
The U.S. dairy industry is experiencing considerable investment in processing infrastructure, exceeding $8 billion nationwide. Notable projects include Walmart’s $350 million facility in Robinson, Texas, which is expected to be operational by 2026, and Fairlife’s $650 million fluid milk plant in New York, along with many others. These investments span multiple dairy product classes, with some facilities replacing outdated plants, others expanding capacity and some new construction. While the full market impact will not be immediate, the short-term effect is likely to support milk prices through at least the first half of 2025. The degree of supply chain coordination for milk between processors and producers will determine how long this support persists—looser coordination could sustain higher milk prices, whereas tighter alignment may lead to a quicker market adjustment.
The sustained strength in beef prices has provided new life and attention to this supplementary income stream. Higher cull cow values and strategic breeding decisions—such as terminally breeding—are optimizing herd management and replacement strategies. Based on our economic modeling of milk supply as well as evidence from recent cow number reports, these farm-level adjustments in dairy cattle inventory are not likely to constrain milk supply in the year ahead. These trends of terminal breeding and close attention to replacement inventory will likely continue influencing dairy production decisions throughout 2025 and beyond.
Bearish Market Drivers
Policy uncertainty is a significant concern for the dairy industry at the moment, with trade, labor and food assistance programs all contributing to potential volatility in 2025. Research by Dr. Charles Nicholson, University of Wisconsin-Madison, has analyzed the potential impacts of these policy shifts on the dairy sector. His economic modeling suggests that various trade policies, labor constraints and reductions in food assistance programs could lead to substantial price reductions and profitability losses for U.S. dairy producers.
Tariffs imposed on major trading partners could disrupt export markets, limiting demand for U.S. dairy products and impacting farm-level prices. The U.S. exports nearly one-fifth of dairy components, primarily non-fat solids, with Mexico, Canada, and China collectively accounting for about 40% of the total value of U.S. dairy exports in 2024. Should retaliatory tariffs be implemented, U.S. dairy products could become less competitive, reducing export sales and affecting domestic farm milk prices. Furthermore, increased tariffs on imported farm equipment may raise production costs, further tightening margins. Nicholson’s research indicates that such trade policies could reduce all-milk prices by as much as $1.90/cwt and decrease cumulative U.S. dairy export values by up to $22 billion over four years. Additionally, the Class III milk price could decline by as much as $2.86/cwt under a scenario where retaliatory tariffs are imposed. Total annual U.S. milk production could fall by 5% to 11% depending on the policy scenario modeled.
Food assistance program reductions also pose a risk to domestic dairy demand. Federal nutrition programs such as the Supplemental Nutrition Assistance Program (SNAP), Women, Infants, and Children (WIC), the Healthy Fluid Milk Initiative (HFMI) and school meal programs play a vital role in supporting dairy consumption. It is estimated that nearly 10% of U.S. fluid milk consumption occurs through school-based programs alone. Reductions in government funding for these initiatives would likely result in lower demand for dairy products, placing additional downward pressure on prices. Nicholson’s projections indicate that policy-driven cuts to food assistance programs could lead to a 4% decline in demand for cheese and fluid milk, further exacerbating market stress. The cumulative loss in U.S. dairy product sales over the next four years due to food assistance cuts could range from $1.2 billion to $4 billion.
Labor and immigration policies remain a pressing concern for dairy producers, particularly for large-scale operations that rely heavily on hired labor. Labor accounts for approximately 25% of total dairy farm operating costs, and for larger farms, this percentage can be higher. Proposed immigration policies that reduce the availability of non-U.S. workers could exacerbate labor shortages, leading to increased wage costs and disruptions in productivity as farms struggle to recruit and train new workers. Dairy processors and cheese manufacturers would also see higher operational expenses as a result of increased labor costs. Research estimates that such policies could raise farm wage costs by 20% while causing a temporary 10% decline in productivity due to labor disruptions. Farm profitability, measured as net farm operating income (NFOI) for a 250-cow dairy, could decline by $27,000 to $110,000 annually, equating to losses of 11% to 46% depending on the policy combination.
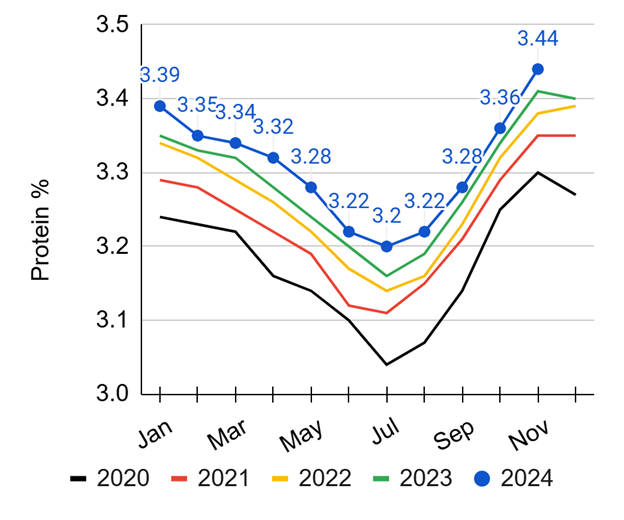
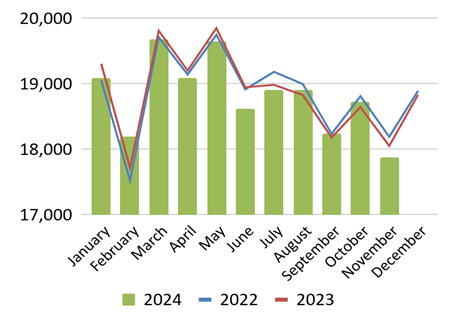
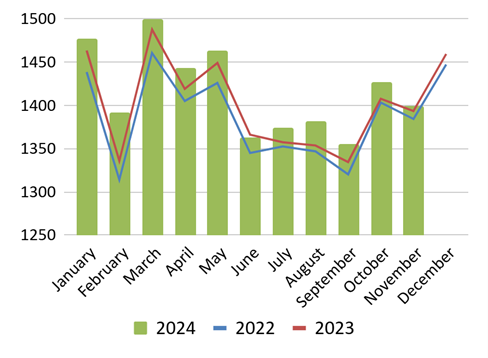
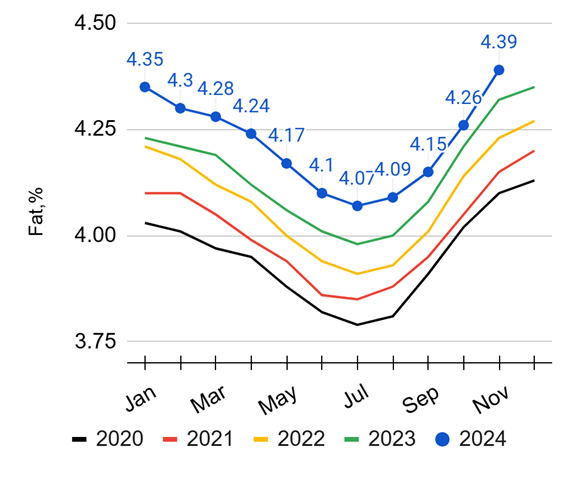
Looking ahead to the end of 2025, bearish factors will include the increasing efficiency of milk solids production and the challenges of managing new dairy products entering the market. While overall milk production declined in 2024, efficiency gains have led to higher milk solids output. As of November 2024, the average U.S. butterfat test reached 4.218%, up 0.088 percentage points from the previous year, while the average protein test rose to 3.309%, an increase of 0.029 percentage points. For context, in 2020, the average butterfat test was 3.95%, and the protein test was 3.181%. Despite a 0.262% year-to-date decline in total milk production in 2024, calculated milk solids production increased by 1.345%, even as the national herd shrank by 557,000 cows. These efficiency gains mean the industry can meet new demand for milk solids more quickly than in the past.
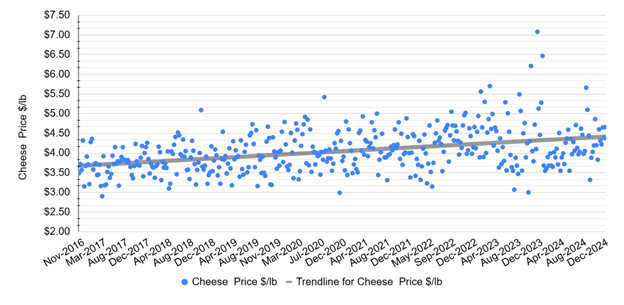
New investments in processing are occurring across all product classes, though much of it is concentrated in cheese production. This shift will lead to greater Class III utilization and, eventually, increased pressure on Class III prices. Analyzing the weighted average advertised retail prices of cheese reported by USDA AMS Dairy Market News from 2016 to 2024, we observe a price floor of approximately $3.20/lb (10th percentile) and a ceiling of $4.17/lb (90th percentile). This persistent $0.97/lb range has made it difficult for Class III prices to sustain upward momentum.
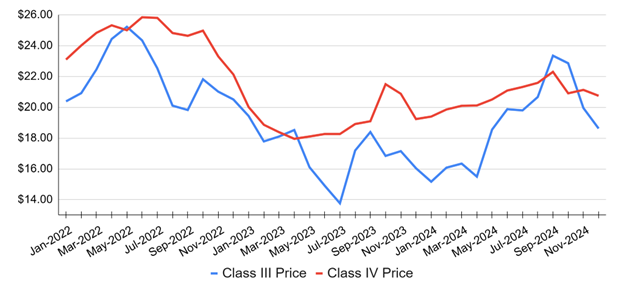
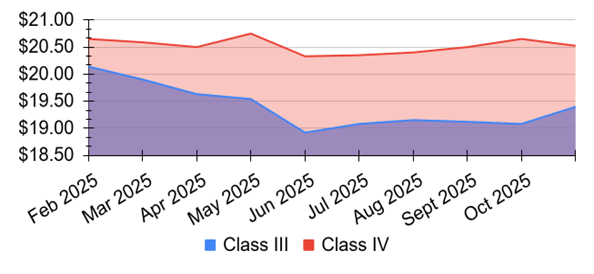
In September 2024, Class III milk prices surpassed Class IV for the first time in 16 months. However, after maintaining their premium for just two months, they quickly retreated.
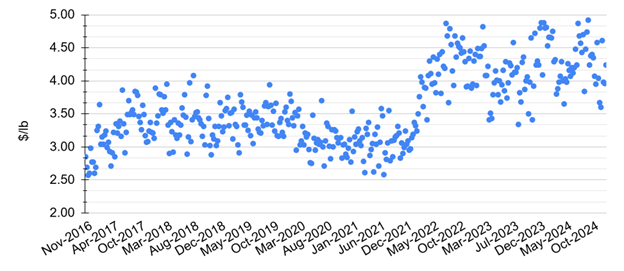
Meanwhile, the weighted average retail price for butter has established a new price range. Prior to April 2022, retail butter prices fluctuated between a floor of ~$2.77/lb and a ceiling of ~$3.78/lb—a range of $1.01/lb. Since April 2022, prices have shifted higher, ranging between a new floor of ~$3.79/lb (the previous ceiling) and a ceiling of ~$4.68/lb, a $0.89/lb range. This sustained increase has provided strong support for Class IV prices.
Historically, less than 2% of U.S. butter production has been exported, suggesting that Class IV prices may be more insulated from current policy uncertainties. However, if we aim to maintain or increase Class III prices in 2025, strong export demand will be needed.
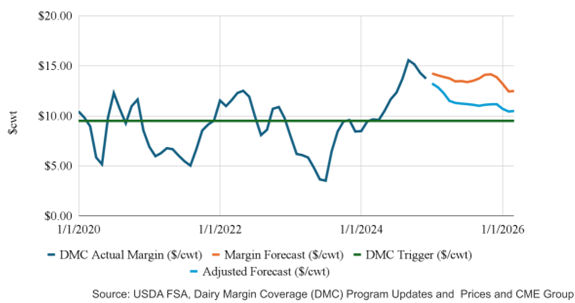
During times of market volatility and price uncertainty, risk management tools have played a role in providing financial stability for dairy producers. The Dairy Margin Coverage (DMC) program remains a key safety net, offering compensatory payments when margins fall below selected coverage levels. By accounting for fluctuations in milk prices and feed costs, the program provides predictable support during downturns.
For 2025, the DMC program continues under the American Relief Act of 2025, maintaining coverage options consistent with prior years. The enrollment period for 2025 runs from January 29 to March 31, 2025.
From 2018 to 2024, DMC issued payments in 48 out of 72 months (66.67% of the time). Over this period, the average payment per cwt was $1.49 per hundredweight (cwt), with a maximum payment of $5.58/cwt. After accounting for the average premium cost of $0.142/cwt, the net indemnity averaged $1.35/cwt. Given potential reductions in the All Milk Price ranging from $0.10 to approximately $3.00/cwt due to policy shifts and FMMO reforms, dairy producers may find DMC enrollment a prudent component of their financial strategy.
As producers consider their approach to risk management in 2025, DMC remains an important option to help mitigate the effects of market downturns. While other risk management tools, such as Dairy Revenue Protection (DRP) and Livestock Gross Margin for Dairy (LGM-Dairy), can complement coverage strategies, DMC provides a stable foundation of support during periods of economic uncertainty.
The dairy industry in 2025 will be influenced by expanding processing capacity and evolving policy frameworks. While increased investment in dairy processing and sustained beef prices may support certain market segments, policy uncertainties, trade disruptions, and labor constraints present significant risks.
Class III prices will likely depend on export demand and the market’s ability to absorb increased cheese production coming later in the year, while Class IV prices may find continued support from higher butterfat values. The impact of Federal Milk Marketing Order reforms, potential shifts in food assistance programs, and broader economic conditions will further influence price movements.
Producers may want to look into risk management strategies such as Dairy Margin Coverage (DMC) and other price protection mechanisms. The ability to adjust/protect against changing supply-demand conditions and regulatory developments could aid in maintaining financial stability in the coming year.
Starting to see Class III/IV Price Spread Return
Class III and IV Price History
U.S. Milk, Fat, and Protein Production Comparison
Monthly U.S. Milk Production
Monthly U.S. Fat and Protein Production
Futures project continued spread and Class III pressure
Class III and Class IV Futures Prices ($/cwt)
USDA Farm Service Agency (FSA) Dairy Market Coverage (DMC) Income Analysis
USDA FSA DMC Income Over Feed Cost, 2023-2024
Retail Cheese and Butter Price Averages
Wtg Average Advertised Retail Cheese Price
Cheese Price Range Bound, Price Sensitivity Constraining Class III Price
Wtg Average Advertised Retail Butter Price
Butter has found new retail price level, supportive of Class IV Price
DMC Margin Forecast
U.S. All Milk Fat Test, %
U.S. All Milk Protein Test, %