For the year 2017, the total number of farm employees in Wisconsin (including crop, horticulture, and livestock farms) was just above 24,000. This estimate comes from the Bureau of Labor Statistics (BLS) which gathers data on all employees covered by state unemployment insurance(UI)1. In comparison, only 16,507 farm employee were reported in 2007. This represents a significant growth in the number of farm employees across the state over the last 10 years. Most of which came from the growth in the dairy sector.
| Year | Crops 2 | Dairy | Other Livestock | All Farms |
| 2007 | 6,445 | 8,332 | 1,730 | 16,507 |
| 2017 | 7,163 | 14,684 | 2,400 | 24,247 |
| Averave annual growth | 1.1% | 5.8% | 3.8% | 3.9% |
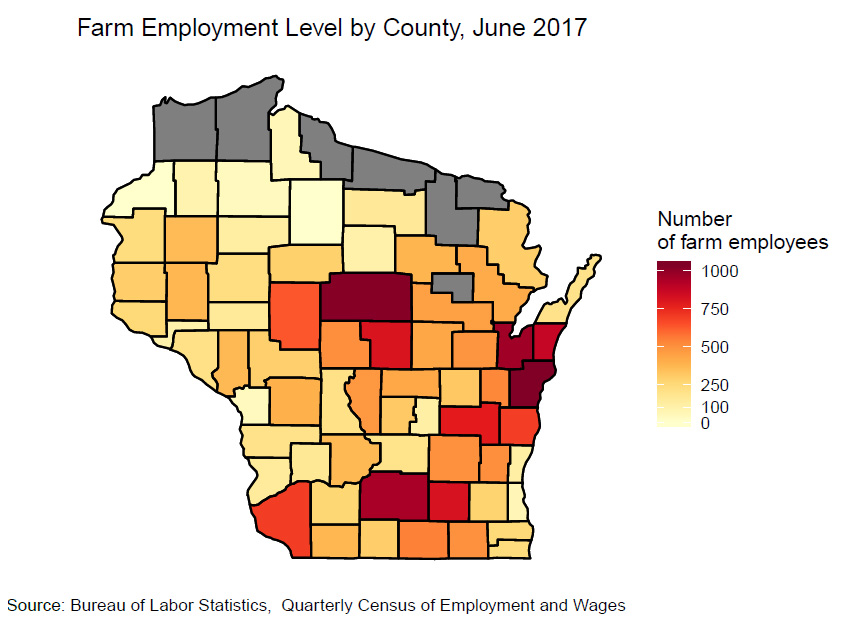
It should not surprise anyone that most farms employees in Wisconsin are based on livestock (dairy) farms located in the eastern part of the state. Manitowoc and Marathon counties each had more than 1,000 farm employees. They were followed closely by Brown and Dane counties. The number of farm employees in the northern and western parts of the state are much lower. In part because the number of farms is lower in those counties, but also because those farms tend to be smaller in size and to rely mostly on family labor.
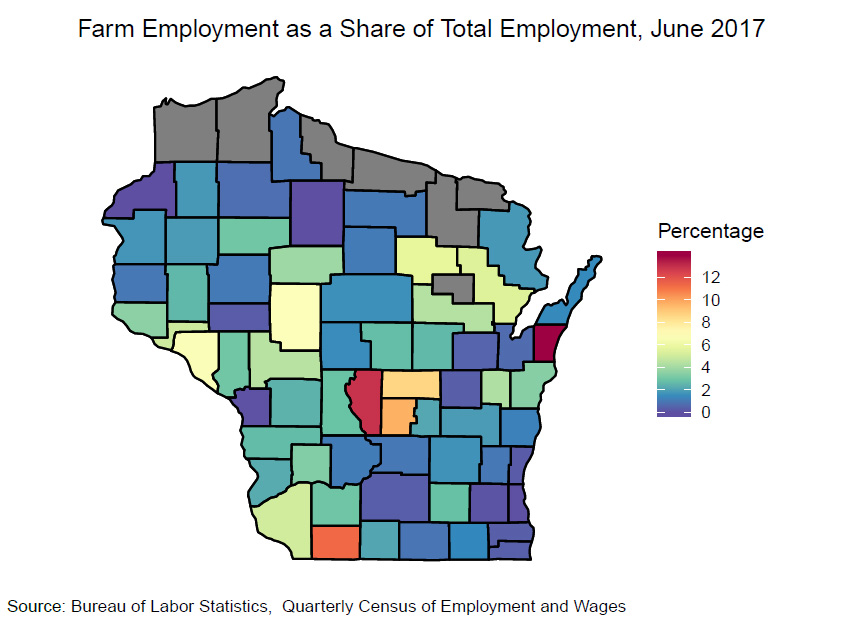
Based on the BLS estimates, farm employment represented less than 1% of total employment in Wisconsin as of June 2017. But in some counties it still represents more than 10% of employment (e.g. Kewaunee, Adams, Lafayette). In some counties with lower density of population (e.g. Buffalo), even if the total number of farm employee is low in comparison to other counties, farming remains an important source of employment for the county itself. In contrast, in counties like Brown and Dane, even if the number of farm employees is high relative to other counties, farm jobs provide a very small share of total employment.
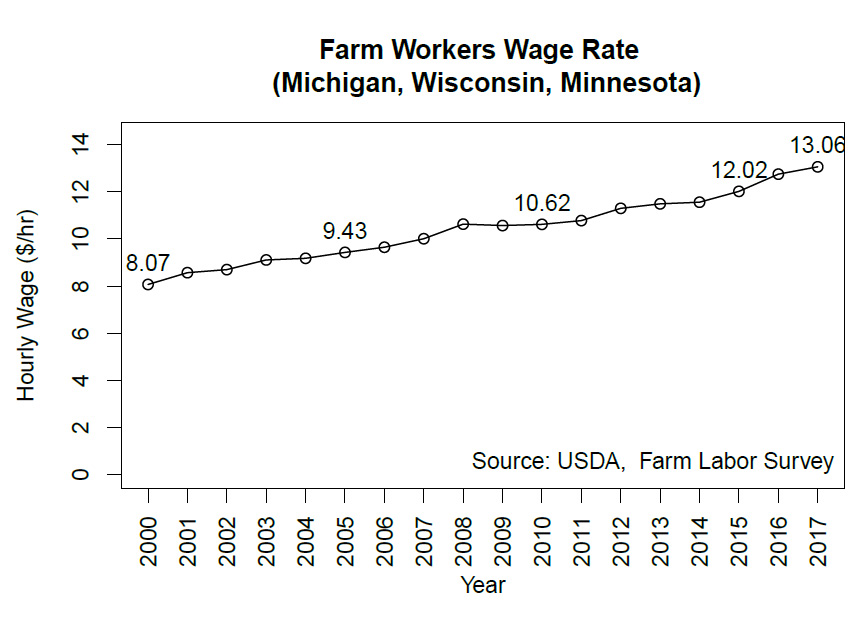
The USDA Farm Labor Survey provides regional information on wages for hired farm workers of livestock and crop farms. The figure above shows the evolution of farm employee wages since the year 2000. Over that period, farm employee wages have increased by 2.9% per year on average. In 2015 and 2016, farm wages increased at a rate of 4.24% per year.
Focus on dairy farms employment
To supplement the existing data collected by the USDA and the BLS, the University of Wisconsin Cooperative Extension(UWEX) and University of Wisconsin Center for Dairy Profitability(CDP) ran a farm labor survey during the spring of 2018. In particular, we wanted to learn about employee turnover rates, and the current sources of farm labor. The survey provides more detailed information about wages for different areas of the state, different employment types, compensation benefits, and the number of new hires and their previous employment status. The results presented here are based on 224 responses received from dairy farms specifically, covering 2,899 employees
Wages of dairy farm employees
Given that labor markets are inherently local in nature, farm wages vary substantially across the state. They also vary based on job descriptions and skill levels of employees. The current farm labor market is extremely competitive with many farm employers having difficulties filling all of their positions. Over the years, farms have consolidated and increased their reliance on and demand for hired labor. At the same time the rural workforce has declined in most counties. Although the presence of immigrant labor did offer respite to farm employers over the last 15 years, this pool of labor is now fully employed. In the past few years it has forced employers to compete more actively for labor and to become more creative in terms of recruitment and retention strategies.
Wage distribution across agricultural districts
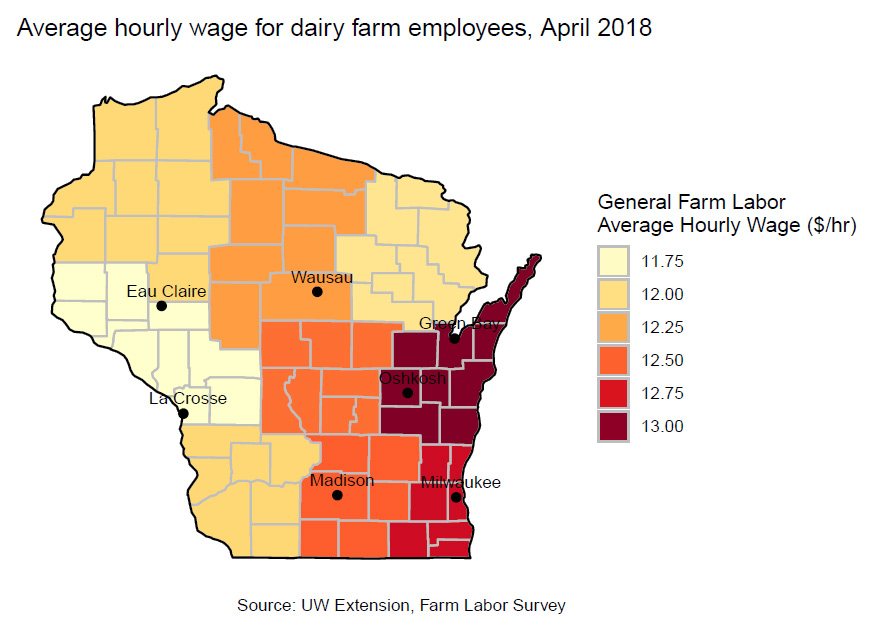
The map below shows the distribution of farm wages (for dairy farms only) across agricultural districts of Wisconsin. Overall, wage levels tend to be higher in the eastern part of the state where most of the large dairy farms are located. Although farms in those areas may have access to larger labor pools due to their proximity to urban population centers, attracting new employees from these centers remains a challenge. And proximity to those centers also means that farm employers must compete for labor with other industries.
Distribution by type of employment
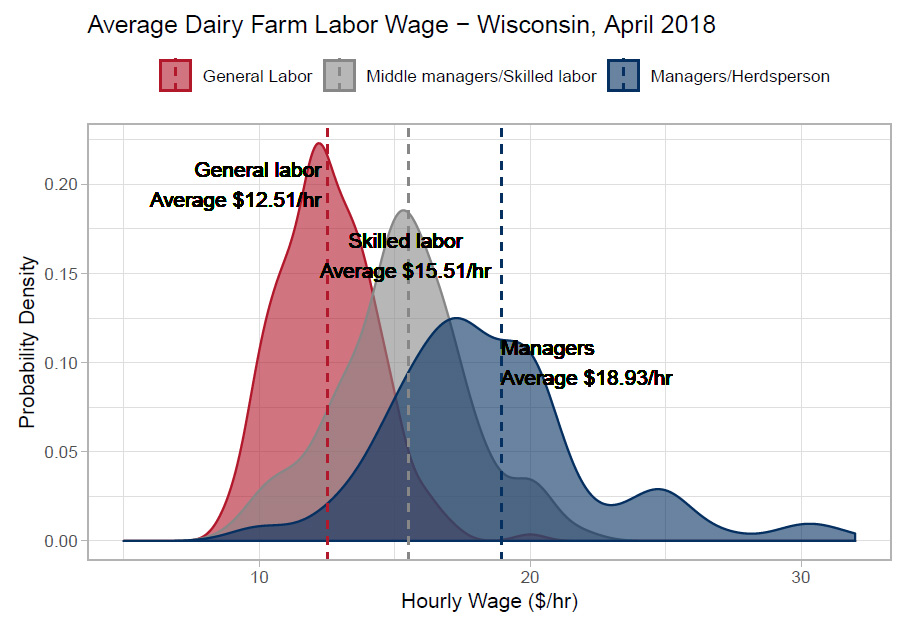
Wages also vary by employment type. The UWEX/CDP survey asked farms about wages for general labor (e.g. milkers), for skilled labor and middle managers(e.g. mechanics, milking shift leaders), and for main managers (e.g herdsperson). As of April 2018, the state average for general labor on dairy farms was $12.51/hour, which is just below the estimate reported by the USDA for farm labor in the Lake States region (MI,MN,WI). For most dairy farms, the average wage for general labor was between $11/hr and $13.5/hr.
For skilled farm labor, reported wages were mostly between $14/hr and $17/hr with and average of $15.51/hr. Finally, there was a lot more variability among reported farm managers/herdsperson wages, some earning less than $15/hr and others earning more than $25/hr. This is likely reflecting the varying levels of experience, qualifications, and responsibilities. The average hourly wage for farm managers/herdsperson was $18.93/hr.
Finally, between April 2017 and April 2018, the average wage raise for dairy farm labor was $0.76/hr.
Employee turnover on dairy farms
In a recent series of interviews 3, dairy managers told us that employee turnover was the biggest cost related to human resource management. Considering the time needed to hire and train a new employee, the normal slump in performance when new employees are introduced, and the stress on other employees, one farm manager estimated the cost of turnover at a minimum of $2,500 to $3,000 for each employee leaving the farm. As one manager said, each time you have a new employee, you must take the time to get to know and understand him or her, and that can take a full year. One farmer using robotics emphasized the value of experience. When it comes to employees working with this kind of technology, each year of experience is valuable. When they go, it’s really hard to replace those years of experience. It’s important to note that farms with a high turnover are likely to su˙er more in tight labor markets.
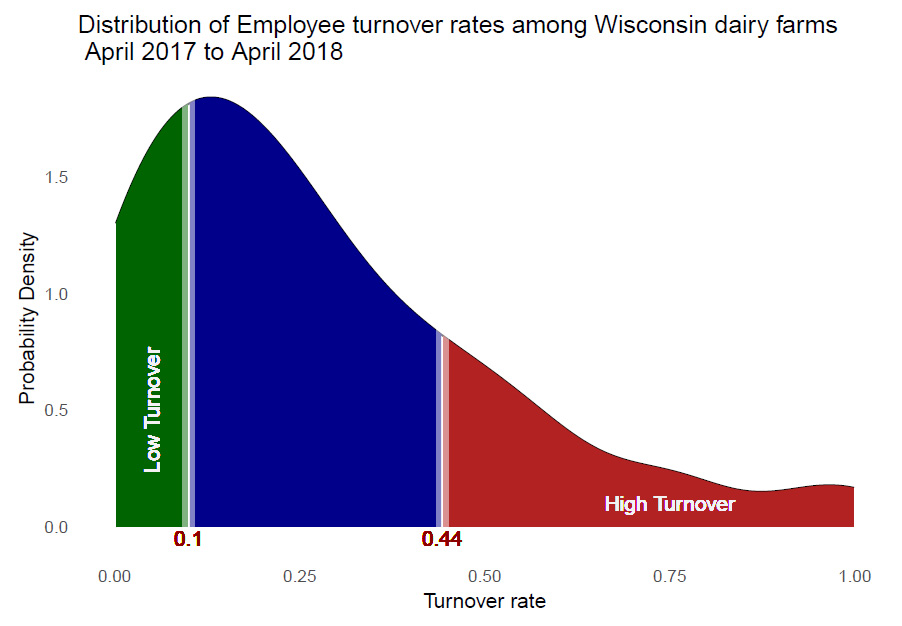
The average employee turnover rate 4 between April 2017 and April 2018 was 34% for dairy farms included in our survey. A quarter of the respondents had a turnover rate below 10% while another quarter of the respondents had turnover rates above 44%. This is relatively high compared to other industries. A 2016 Benchmark report by the Society for Human Resource Management reports an average annual turnover rate of 19% for the broad array of industries they surveyed. They also estimated the average cost per new hire at$4,129/hire.
Employee benefits on dairy farms
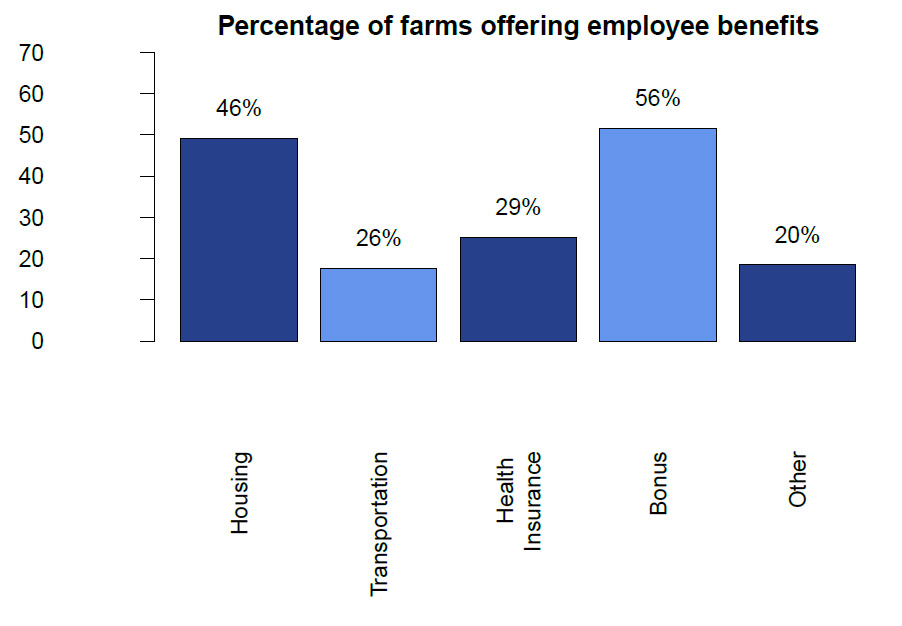
Providing greater benefit packages is key to recruitment and retention e˙orts. As part of the UWEX/CDP labor survey, 46% of dairy farms indicated that they provide housing benefits to some of their employees. Some sort of transportation benefits was provided to employees by 26% of respondents, and another 29% of respondents o˙ered health insurance benefits. Among other employment benefits provided by dairy farms, the most commons were phones, food, uniforms, flexible schedules, and paid vacations.
The more limited are your resources as an employer, the more creative you must be to attract and retain good employees. In developing an attractive compensation package, it can be worth taking the time to know your employees well enough to be able to tailor a benefits package that is at the same time a˙ordable to you and appealing to them.
 Employee recruitment and sources of farm labor
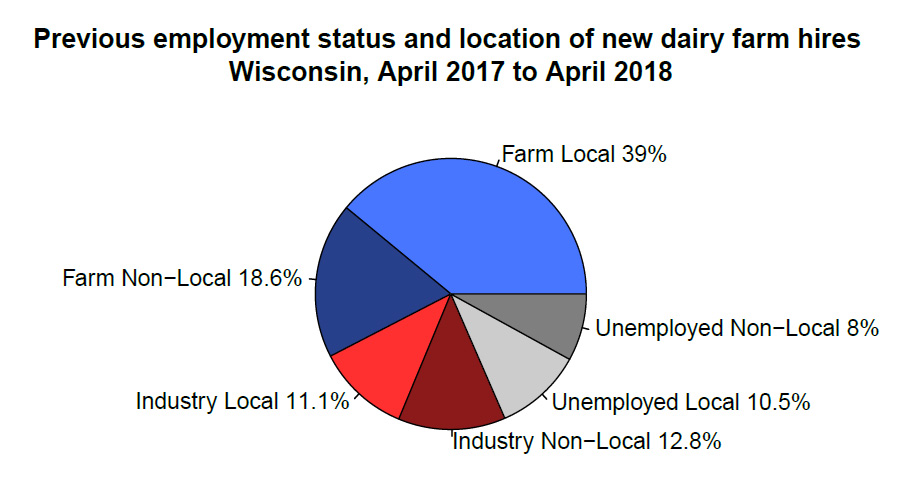
The survey also asked how many new hires the farm made in the last 12 months, and the previous employment status of those new hires. Labor coming from other local farms (within 30 miles of their farms) accounted for 39% of new hires in the last 12 months. Another 11% came from other local industries and 10% were local and previously unemployed. The remaining 40% were non-local hires. The argument has been made that dairy farms have to be increasingly creative and flexible in finding new employees, looking for nontraditional sources of labor and being willing to accommodate their needs ( e.g. schedule, transportation needs). Our survey results show some potential to attract employees from other industries and locations.
Recruiting employees from other industries and unemployed
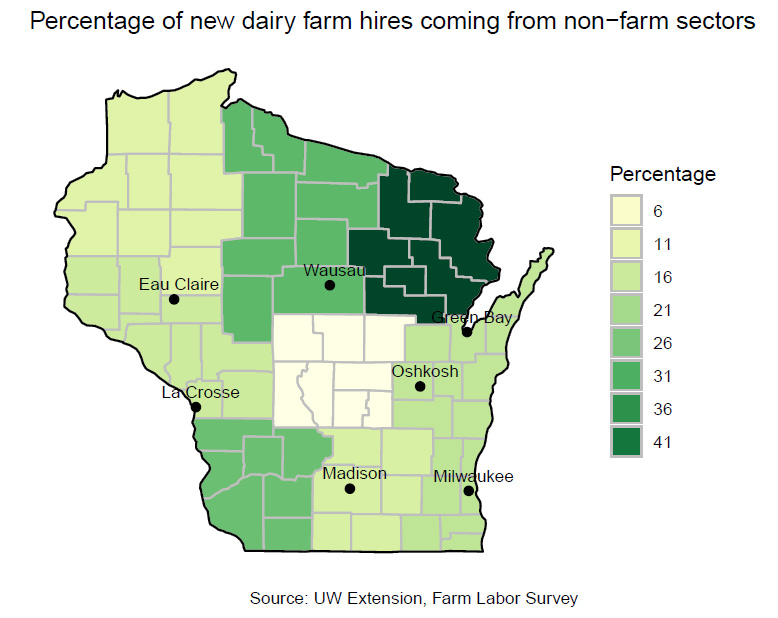
While most farm hires come from other farms, there was still 24% of new farms hires across the state that were recruited from other industries and another 19% that were previously unemployed 5. This percentage was up to 36% in the central agricultural district, implying that one employee out of three came from the non farm sector. In general, farms on the eastern part of the state had a greater proportion of new hires that had previous employment in other industries. It leaves open a number of questions: What kind of industry did they come from? What type of farm employment did they obtain? How were they recruited? But at the very least it shows that some farm employers were able to attract new employees to the farm sector and broaden the labor pool.
Local vs non-local labor pools
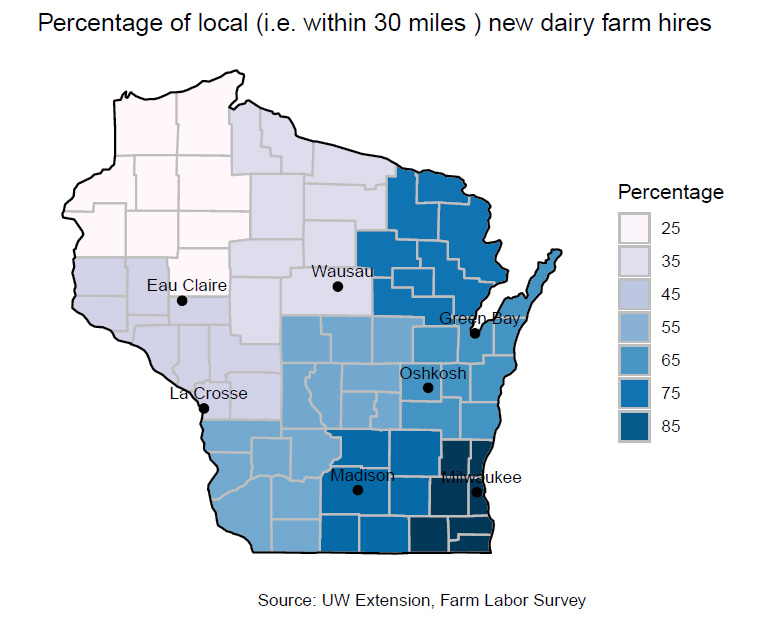
About 68% of dairy farm hires between April 2017 and April 2018 were local. That is the employee’s previous place of work was within 30 miles of the farm. However, farms in the western part of the state tend to rely a lot more on hiring from non-local sources, while farms in the eastern part of the state hire more locally. In part this can be explained by the proximity of urban centers and the larger density of the farm population. Nevertheless, having the ability to reach beyond your local labor pool will increase chances of success in recruiting.
1 This estimate of 24,000 farm employees in Wisconsin could be viewed as a lower bound estimate since agricultural employer in Wisconsin must provide UI coverage only if a) they “paid cash wages of $20,000 or more in a quarter” or b) they “employed ten or more individuals”. For more details see the information provided by the Wisconsin Department of Workforce Development at https://dwd.wisconsin.gov/ui201/t1201.htm. As a result, some farm employees may not be capture in the BLS data. However, regional statistics for the Lake States (MN, MI, and WI) coming from the USDA Farm Labor Survey, which targets all farms with at least $1000 in sales, suggest that the BLS estimate of 24,000 is accurate.
2 Includes oilseeds, grains, forages, vegetables, fruits, orchards, greenhouses and nurseries.
3 More details regarding the dairy farm managers interviews on human resources management are available from the author.
4 Turnover rate was calculated as Number of departures(voluntary and involuntary)/Total number of employees.
5 The unemployed category included students and new graduates.