Table of Contents
Introduction
As 2024 ends, 2025 looks to bring challenges and opportunities for the year ahead. Milk production is expected to grow through the remainder of 2024 and into 2025 driven by growth in the US dairy herd and ever-improving productivity in milk production.
Lower feed costs and strong demand for beef-on-dairy heifers have bolstered cow prices, even so, increased margins and anticipated demand for milk from processors have led to herd expansion. Milk production is expected to grow and with it, likely downward pressure on milk prices.
U.S. cheese and butter exports are gaining a competitive edge internationally, though their success depends on global demand and trade conditions.
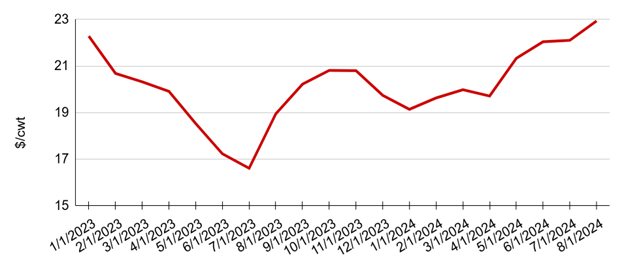
U.S. Mailbox Milk Price
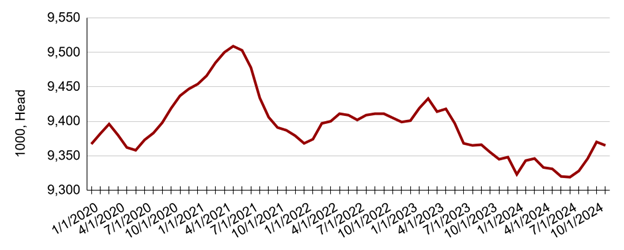
The latest USDA-AMS report has its latest Mailbox Milk Price Report up (Figure 1) with a month-on-month increase of 3.76%. Price increases in the last quarter of the year have been largely driven by seasonality and strong demand in the cheese market.
Number of Milking Cows
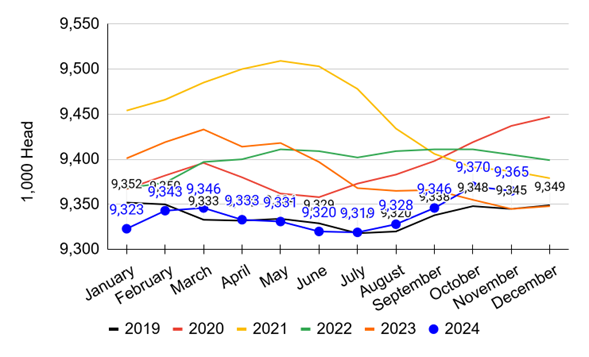
The United States Department of Agriculture (USDA) National Agricultural Statistics Service (NASS) report updated cow numbers to 9.365 million for November 2024 (Fig. 2). Despite a (Fig. 3) month-over-month decline of -5,000 head followed by a percentage decline of -(0.05)% as of November 2024, the year-over-year change in cow numbers shows an increase of 20,000 head with a percentage increase of 0.21% for November 2024 compared to November 2023.
Monthly Dairy Cow Livestock Slaughter
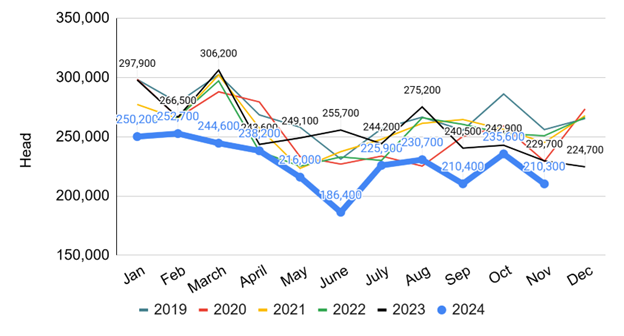
The Livestock Slaughter report by NASS shows the number of dairy cows slaughtered in November 2024 was 210,300 head (Figure 4). This is a month-over-month decline of -25,300 head in August 2024, with the percentage decrease of -(10.74)%. The month-over-month decline in cow slaughter is accompanied with the year-over-year decline to -19,400 head with a percentage decline of (-8.45)% slaughtered during the same period in 2023. There is also a year-to-date decline of 350,500 head with year-to-date percentage decline of (-12.29)% as of November 2024.
Milk Fat and Protein Percentages
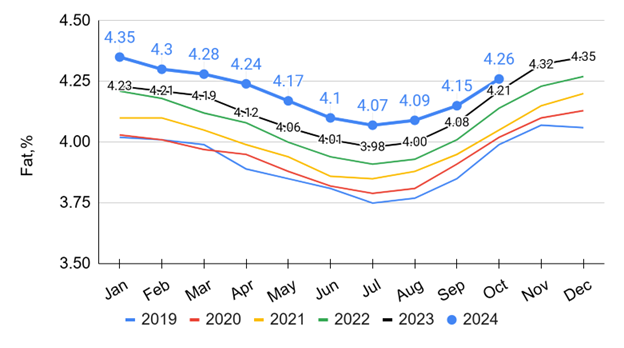
The monthly average fat test rose from 4.21% in October 2023 to 4.26% in October 2024 (Figure 5). There is a month-over-month increase of 0.11%, followed by a year-over-year increase of 0.05% compared to the previous year as of October 2024.
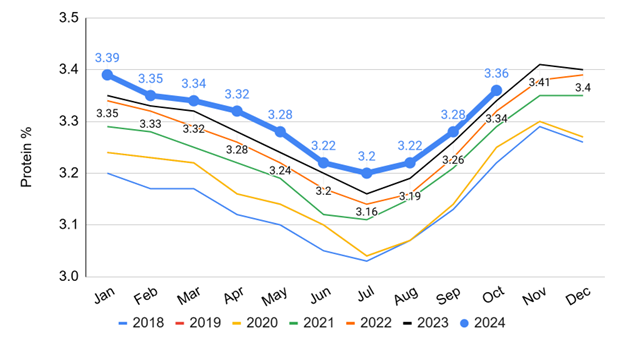
Similarly, milk protein test values have been on a year-over-year rise, averaging 3.32% in 2022, 3.34% in 2023, and 3.36% in October 2024 (Figure 6). There is an increase of approximately 0.02% as of October 2024 compared to the same period in the previous year.
U.S. All Milk Fat Test %
U.S. All Milk Protein Test %
Milk Production Per Cow
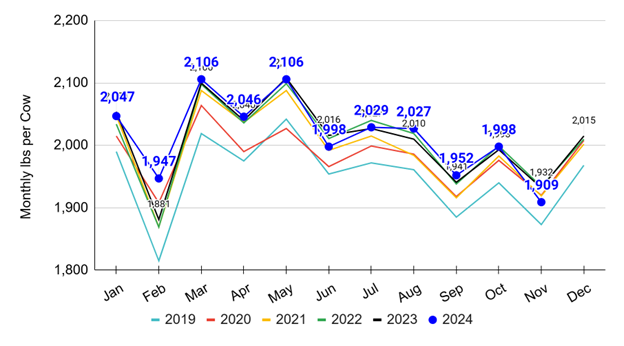
The US dairy herd had an average monthly milk production per cow of 1,909 lbs in November 2024 (Figure 7). The month-over-month decrease of 89 lbs is followed by a decline of 23 lbs in year-over- year milk production per cow in November 2024 compared to the same period in the previous year. Thus the month-over-month percentage decline remained -0.49% whereas year-on-year percentage decline was -1.19% as of November 2024. The year-to-date milk production remained up with 63 lbs, a percentage increase of 0.29% as of November 2024.
U.S. Milk Production Year Over Year
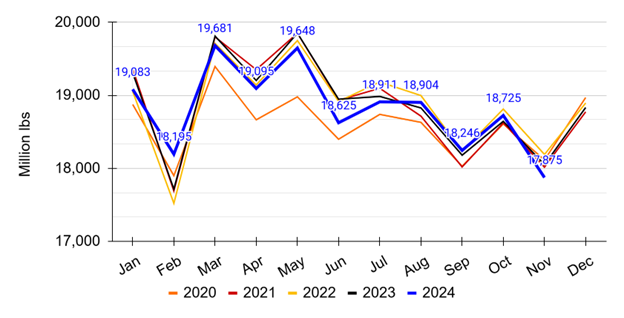
The year-over-year U.S. total monthly milk production is 17.87 million lbs as of November 2024 (Figure 8). This represents a decrease of 176.0 million lbs compared to the same period in 2023, indicating approximately a -(0.98)% decline in November 2024. The month-over-month U.S. total milk production also declined to approximately -850.0 million lbs as of November 2024. Thus the percentage decline remained -4.54%.The year-to-date milk production followed the same declining trend of -543.0million lbs by year-to-date percentage decline of -0.26% as of November 2024.
Global Milk Supply and Exports
When looking at the data for “Global Supply Variation in the Key Exporters of Dairy Products” by CLAL (https://www.clal.it/en/?section=latte_mensile) for July 2024, the USA’s variation is positive. The year-over-year reduction in dairy supply from the United States is approximately 0.9% as of October 2024 (Figure 9).
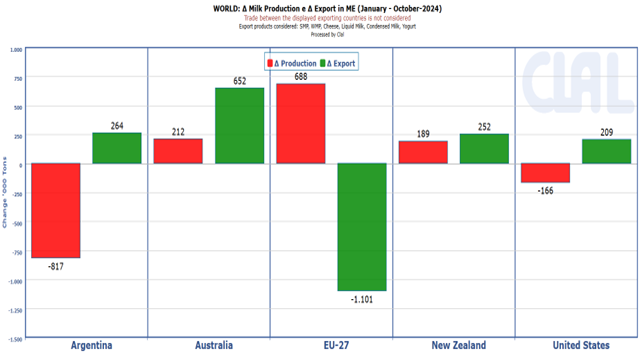
Similarly the statistics for “WORLD: Δ Milk Production e Δ Export in ME (January – July-2024)” by CLAL (https://www.clal.it/en/mini_index.php?section=prod-export-me-countries ) from January to July 2024, U.S. milk production saw a slight drop of 166 metric tons, while exports increased marginally with 209 metric tons as of October 2024. Exports mainly include the exports of cheese, fluid milk, condensed milk, yogurt, SMP, and WMP (Figure 10). The US continues to allocate more of its available supply to export markets despite lower overall production. The trend reflects the continued importance of exports in balancing the U.S. dairy market. Furthermore The U.S. dairy market is in a competitive export situation, and to maintain higher farm prices, exports must continue through the remaining months of 2024 and well into 2025.