
Updated September 30, 2026. On September 15, the United States added Canadian cheese to its 50% tariff list. On September 29, the United States banned imports of Canadian whey products under Section 338 of the Tariff Act of 1930. A companion article on the import ban is forthcoming. The text below has been corrected where these actions changed the facts stated at publication.
Key Findings
- Both countries have put new tariffs on each other’s dairy. Since August 19, 2026, the United States has charged 50% on Canadian whey products, milk proteins, lactose, casein, and milk powders. Canada’s answer takes effect September 8: 50% on the same kinds of U.S. ingredients and 25% on all U.S. cheese. Neither country tariffed butter, fluid milk and cream, yogurt, or ice cream. On September 15, the United States added Canadian cheese to its 50% list. On September 29, the United States banned imports of Canadian whey products.
- Canada’s tariffs apply to product inside the import quotas. Since the USMCA took effect, U.S. dairy entering within Canada’s tariff free quotas has paid no tariff. Now it will. The old over quota tariffs of roughly 241% to 298% are unchanged and are not being paid; they stop trade above the quotas.
- U.S. dairy sales to Canada were about $1.3 billion in 2025, 14% of U.S. dairy exports. The tariffed products that can be measured at customs value total about $255 million. Butter, the largest single sale at $228 million, is not tariffed in either direction.
- Filling Canada’s quotas completely would change U.S. milk prices very little. The cheese, butter, and cream quotas already fill; the skim milk powder quota is empty because there is no price difference to earn. Filling every quota would add roughly $30 to $120 million per year of exports, about $0.01 to $0.05/cwt.
- The price effect comes through cheese and whey prices. Each $100 million of lost exports is about $0.04/cwt spread across U.S. milk. The Class III price is calculated from cheese and dry whey prices, the two products Canada tariffed: a $0.01/lb drop in cheese lowers Class III about $0.10/cwt, and in dry whey about $0.06/cwt. Scaling the closest published model to a Canada only action, with the arithmetic shown in the paper, gives an anchor estimate of roughly $0.20 to $0.35/cwt for a sustained action, inside a wider planning range of $0.10 to $0.50/cwt.
- Wisconsin is more exposed than other states. The tariffs land on cheese and on the whey made from cheese. The anchor estimate equals roughly $65 to $113 million per year across Wisconsin farm milk sales, about $51 to $90 per cow; the wider planning range is $32 to $162 million.
- The size of the effect depends on duration and relief. Dairy imported into Canada for re-export is not automatically exempt; relief must be applied for. All figures here are before relief.
What Happened, and in What Order?
The United States acted first. On July 20, 2026, the President signed proclamations under Section 338 of the Tariff Act of 1930, which allows tariffs of up to 50% on goods from a country the President determines is discriminating against U.S. commerce. The dairy proclamation states that Canada discriminates in how it hands out the USMCA cheese quota: Canadian retailers cannot hold USMCA cheese quota but can hold quota for European cheese (The White House, 2026a). That is a U.S. determination, not a trade panel ruling; the last USMCA panel on the subject, in November 2023, sided with Canada. The tariffs were set to take effect August 19. On August 18, the President suspended them for three days after Canada committed to remove the discrimination. Canada did not, and the tariffs took effect August 22 (The White House, 2026b).
The products on each list are shown in Table 1 and in its note; the two lists are close copies. Both put 50% on protein ingredients and powders (milk powders, whey and whey protein, milk protein concentrate, casein) and left butter, fluid milk and cream, yogurt, and ice cream alone. Cheese was the one difference at first: Canada put 25% on U.S. cheese, while the United States initially left Canadian cheese off its list even though cheese quota administration is the stated reason for the U.S. action. On September 15, the United States added Canadian cheese to its 50% list (The White House, 2026c).
Why Are There Two Different Dairy Tariffs in the News?
Press coverage and constituent questions often mix up two tariffs that do different jobs. Canada’s supply management system keeps domestic milk prices well above world prices, which only works if imports are limited. The limits are the old over quota tariffs, roughly 241% on fluid milk to 298% on butter, which apply only above the tariff free quotas Canada has agreed to in the WTO and in its trade agreements (Polzin, 2025a). The USMCA created 14 dairy quotas that together give the United States tariff free access to about 3.5% of Canada’s dairy market, phased in through the late 2030s. The September 8 tariffs are separate. They are retaliation in the broader trade dispute, and they apply to trade that is happening now.
Is product brought into Canada for re-export exempt?
No, not automatically. The Import for Re-Export Program permit that Canadian food manufacturers use deals with the over quota tariff. The new tariff (a surtax, in Canada’s legal terms) is a separate charge collected by the Canada Border Services Agency when goods enter. Relief exists through CBSA’s Duties Relief Program, which can waive it at the border, and Duty Drawback Program, which refunds it after export; for the 2025 tariff orders CBSA stated both apply, and that for U.S. made goods the USMCA limit on drawback does not apply (Canada Border Services Agency, 2025; Global Affairs Canada, 2026). Relief must be applied for, and no agency reports how much trade uses it, so every exposure figure in this paper is before relief.
What Actually Crosses the Border?
U.S. dairy exports to Canada were about $1.3 billion in 2025, second only to Mexico and about 14% of U.S. dairy exports; U.S. dairy imports from Canada were $432.7 million (Stahl, 2026). Table 1 lists the products that can be measured, using 2025 customs values as reported by Canada to the United Nations. The quota column asks one question: is this a product Canada controls at the border under supply management, with a tariff free import quota and a very high tariff above it, or a product that enters Canada freely?
Table 1. Dairy Products Traded Between the United States and Canada, and How Each Is Treated
| Product (HS heading) | U.S. exports to Canada, 2025 | Canadian exports to U.S., 2025 | Does Canada limit imports of this product with a quota? | Canada’s new tariff (Sept. 8) | U.S. new tariff (Aug. 22) |
|---|---|---|---|---|---|
| Butter and milk fats (0405) | $228M | $12M | Yes. USMCA quota 4,545 MT plus WTO quota; about 298% tariff above the quota | None | None |
| Infant formula (1901.10) | $151M in 2021 (ERS); 2025 not separately available | None; Canada exports no infant formula | No. Enters tariff free | None | None |
| Cheese (0406) | $134M | $91M | Yes. USMCA and WTO quotas; high tariff above the quota | 25% | 50% (from Sept. 15) |
| Whey and milk protein concentrate (0404) | $82M | $69M | Partly. Whey powder has a quota; milk protein concentrate has largely entered outside the quotas | 50% | 50%; whey banned from Sept. 29 |
| Fluid milk and cream (0401) | $68M | $11M | Yes. USMCA quotas of 50,500 MT milk and 10,605 MT cream plus WTO quota; about 241% tariff above the quota | None | None |
| Casein and caseinates (3501) | $21M | n/a | No. Enters tariff free | 50% | 50% |
| Milk powders, evaporated and condensed milk (0402) | $17M | $8M | Yes. USMCA quota of 7,575 MT for skim milk powder plus small quotas | 50% | 50% |
| Yogurt, buttermilk, kefir (0403) | $4M | $78M | Yes. Small USMCA quota plus WTO quota | None | None |
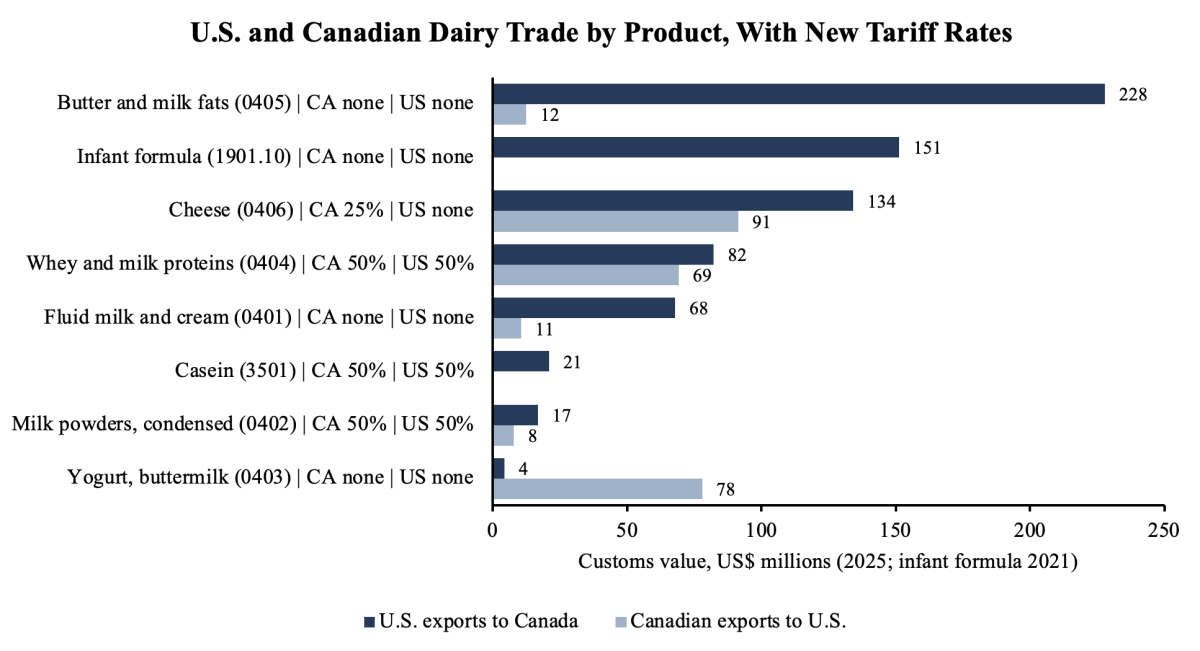
Butter is the largest U.S. dairy sale to Canada and is not tariffed by either country, which reflects Canada’s butterfat shortage. Whey and milk proteins are the only products traded in similar amounts both ways, and both countries now charge 50% on them. Yogurt runs the opposite way, $78 million south against $4 million north, and is not tariffed. Of the $533 million of U.S. sales in the Chapter 4 dairy headings, the tariffed headings are 44% and the exempt headings 56%; with casein, the tariffed trade that can be measured is about $255 million. The other roughly $750 million of the $1.3 billion is outside Chapter 4 and cannot be split with the data used here; it includes both exempt products (infant formula, lactose, ice cream) and tariffed ones (bakery mixes, milk albumin, milk protein isolate).
High Protein Whey
Whey protein concentrate up to 80% protein (heading 0404) and above 80%, such as WPC 80 and whey protein isolate (heading 3502), are on Canada’s 50% list, and the U.S. 50% tariff covers Canadian whey products. Since September 29, Canadian whey products under heading 0404.10 are banned from importation into the United States; heading 3502 is not on the ban list (The White House, 2026b).
U.S. exports of whey protein concentrate to Canada were about 12,800 metric tons in 2025; the data do not separate low from high protein product. High protein whey has been expensive in the United States: the Dairy Market News price for 34% whey protein concentrate rose from about $1.52/lb in January 2025 to about $1.94/lb in late July 2026 (U.S. Department of Agriculture, Agricultural Marketing Service, 2026b). The two tariffs pull in opposite directions for U.S. prices, reducing both U.S. sales to Canada and Canadian supply into the United States, and the net direction is not determined here.
How Does a Tariff on 14% of Exports Reach a Farm Milk Check?
Exporters lose sales to Canada; some product is sold elsewhere at lower prices, some of the tariff is absorbed, and some product stays home. Product that stays home pushes down U.S. wholesale prices for cheese and whey. The Class III price is calculated from those prices, so the effect reaches every farm priced off Class III, whether or not its milk went to Canada. Table 2 gives a floor: it spreads lost revenue over all milk and leaves out that price transmission.
Table 2. Export Losses Converted to Farm and Wisconsin Terms
| Annual export value lost | Spread across all U.S. milk ($/cwt, 2.3 billion cwt) | Per year, 250 cow herd | Wisconsin statewide, per year (324 million cwt) |
|---|---|---|---|
| $100 million | About $0.04/cwt | About $2,600 | About $14 million |
| $250 million (about the measurable tariffed trade) | About $0.11/cwt | About $6,500 | About $35 million |
| $500 million | About $0.22/cwt | About $13,000 | About $70 million |
| $1.2 billion (entire Canadian market, including products not tariffed; upper bound) | About $0.52/cwt | About $31,000 | About $169 million |
The Class III price
In the Class III formula, a $0.01/lb change in the cheese price changes Class III by about $0.10/cwt, and a $0.01/lb change in dry whey by about $0.06/cwt. If displaced product lowered cheese by $0.02/lb and dry whey by $0.01/lb, Class III would fall about $0.26/cwt. That is arithmetic about the formula, not a forecast. Butter and cream were left off the list, so the Class IV price, calculated from butter and nonfat dry milk, is mostly outside these tariffs.
The closest published model
Nicholson (2025), summarized in Polzin (2025b), modeled 25% retaliatory tariffs imposed at once by Mexico, Canada, and China: the all milk price falls $1.20 to $1.90/cwt, Class III $2.40 to $2.90/cwt, and net farm operating income for a medium sized farm $28,000 to $56,000 per year. Scaling that to Canada alone takes three steps, all in the workbook. First, the three modeled countries took 51% of U.S. dairy exports in 2024 (Mexico $2.47 billion, Canada $1.18 billion, China $0.58 billion of $8.25 billion); Canada alone took 14%, a ratio of 0.28, so the model’s all milk change scaled by trade share is $0.33 to $0.53/cwt. That is a ceiling: it treats all Canadian trade as tariffed at 25%, as in the model, and the model shock also reached butter and Class IV. Second, only 44% of the measurable Canadian trade is tariffed, but the tariffed products face 25% on cheese and 50% on the rest, about 1.5 times the modeled rate when weighted by value; together those give a factor of about 0.65. Third, applying it gives roughly $0.20 to $0.35/cwt, the anchor estimate for a sustained Canada only action. Scaling by trade share is a simplification, and the unmeasured Canadian trade leans exempt, so the anchor may be slightly high.
Which number to use
The three methods do different jobs. Table 2 is a floor: it spreads lost revenue over all milk and leaves out price transmission, and its $250 million row gives $0.11/cwt. The Class III formula is a translator: it converts a cheese or whey price change into a milk price change but does not say how far prices will move. The scaled model is the anchor: roughly $0.20 to $0.35/cwt for a sustained action, with the trade share scaling of $0.33 to $0.53/cwt as a ceiling. The paper’s planning range of $0.10 to $0.50/cwt brackets the floor and the ceiling. Losses for plants and farms that sell directly to Canada are much larger than any of these averages, and the size depends on duration, redirection, absorption, and relief.
What Is at Stake for Wisconsin?
About 90% of Wisconsin milk goes to cheese, and the state made 3.64 billion lbs of cheese in 2025, about 25% of U.S. output. Canada is Wisconsin’s largest export market for agricultural products as a whole, taking 36.5% of the state’s agricultural exports in the first quarter of 2025 (Wisconsin Department of Agriculture, Trade and Consumer Protection, 2025); a dairy only breakdown by destination was not available. The tariffs fit the state’s product mix: cheese gets 25%, and the whey and whey protein from the same cheese vats get 50%.
Wisconsin marketed roughly 324 million cwt of milk in 2025. The anchor estimate of $0.20 to $0.35/cwt equals roughly $65 to $113 million per year across Wisconsin farm milk sales and, at about 25,600 lbs/cow, roughly $51 to $90 per cow per year; the wider planning range of $0.10 to $0.50/cwt is $32 to $162 million, or $26 to $128 per cow. The product that would actually be displaced is small next to that: if U.S. cheese exports to Canada (about 52 million lbs in 2025) were split by Wisconsin’s 25% share of U.S. cheese output, about 13 million lbs would come from Wisconsin plants, roughly 0.4% of the state’s cheese production. The price effect on all 324 million cwt is the larger exposure. Exposure is also concentrated: particular plants sell to Canada, and for their patron farms the 2017 Grassland episode, roughly 1 million lbs per day and 75 farms displaced in weeks, is the relevant scale.
What to Watch
- CBSA guidance on the September 8 order, especially whether the Duties Relief and Duty Drawback treatment stated for the 2025 orders carries over. That decides how much of the further processing trade actually pays the tariff.
- Reported cheese and dry whey prices in the National Dairy Products Sales Report through October. Displaced product shows up here first.
- Monthly export data for September onward, by product and country, first available in late October. Watch cheese, dry whey, whey protein concentrate, and milk protein concentrate to Canada against the same products to Mexico and Southeast Asia.
- Changes to either list, and any settlement of the cheese quota allocation issue, which would remove the stated basis for the U.S. tariffs.
A Note on Methods and Sources
Production, price, and trade figures are computed from USDA NASS, AMS, FSA, and Census series and from the primary sources cited below; customs values by product are from UN Comtrade with Canada reporting; quota data are from USDA FAS. Per cwt figures divide dollars by about 2.3 billion cwt of U.S. milk marketed. Class III sensitivities come from the formulas in 7 CFR 1000.50. A companion Excel workbook holds every calculation as a live formula with the data behind each figure, and a longer version of this paper covers the industry comparison, Canada’s milk use, the quota history, and the sugar question. Scenarios are labeled as bounds or inferences.
This document describes trade flows, prices, program rules, and market arithmetic. It does not take a position on what either government should do.
Published: Sept. 8, 2026
Last Updated: Sept. 30, 2026
Reviewed by: Trevor K. Woolley, Ph.D., Assistant Professor of Agricultural and Applied Economics, University of Wisconsin–Madison, and Jeffrey Hadachek, Ph.D., Assistant Professor of Agricultural and Applied Economics, University of Wisconsin–Madison
References
- Canada Border Services Agency. (2025). Customs Notice 25-10: United States Surtax Order (2025-1). https://www.cbsa-asfc.gc.ca/publications/cn-ad/cn25-10-eng.html
- Cheese Reporter. (2026, September 11). Canada’s tariffs on US dairy imports go into effect; US bans Canadian whey products. https://cheesereporter.com/news/2026/09/11/canadas-tariffs-on-us-dairy-imports-go-into-effect-us-bans-canadian-whey-products/
- Department of Finance Canada. (2026a). Canada’s response to U.S. tariffs on Canadian goods. Government of Canada. https://www.canada.ca/en/department-finance/programs/international-trade-finance-policy/canadas-response-us-tariffs.html
- Department of Finance Canada. (2026b). Complete list of U.S. products subject to counter tariffs. Government of Canada. https://www.canada.ca/en/department-finance/programs/international-trade-finance-policy/canadas-response-us-tariffs/complete-list-us-products-subject-to-counter-tariffs.html
- Global Affairs Canada. (2026). Answers to common questions about U.S. tariffs. Trade Commissioner Service. https://www.tradecommissioner.gc.ca/en/market-industry-info/search-country-region/country/canada-united-states-export/us-tariffs/answers-common-questions-tariffs.html
- Nicholson, C. (2025). Dairy supply chain impacts of representative policy options affecting trade, labor, and food and nutrition programs (Information Letter 25-01). Dairy Markets and Policy. https://dairymarkets.org/PubPod/Pubs/IL25-01.pdf
- Polzin, L. (2025a). U.S.-Canada dairy trade dispute: Quotas, trade flows, and economic impacts. University of Wisconsin-Madison Division of Extension. https://farms.extension.wisc.edu/articles/u-s-canada-dairy-trade-dispute-quotas-trade-flows-and-economic-impacts/
- Stahl, C. (2026, July 24). US to impose 50% tariffs on some dairy imports from Canada, starting on August 19. Cheese Reporter. https://cheesereporter.com/news/global-trade-tariffs/2026/07/24/us-to-impose-50-tariffs-on-some-dairy-imports-from-canada-starting-on-august-19/
- The White House. (2026a, July 20). Imposing additional duties to offset Canadian discrimination against the commerce of the United States with respect to dairy [Presidential proclamation]. https://www.whitehouse.gov/presidential-actions/2026/07/imposing-additional-duties-to-offset-canadian-discrimination-against-the-commerce-of-the-united-states-with-respect-to-dairy/
- The White House. (2026b, September 8). Excluding certain Canadian products from importation into the United States in response to continued discrimination against the commerce of the United States with respect to dairy (Proclamation 11062). Federal Register, 91(176), 58319–58323. https://www.federalregister.gov/d/2026-18836
- The White House. (2026c, September 8). Fact sheet: President Donald J. Trump modifies Section 338 tariffs and imposes import bans on certain Canadian products. https://www.whitehouse.gov/fact-sheets/2026/09/fact-sheet-president-donald-j-trump-responds-to-canadas-retaliation/
- United Nations. (2026). UN Comtrade database. https://comtradeplus.un.org/
- U.S. Department of Agriculture, Agricultural Marketing Service. (2026a). National dairy products sales report [Weekly data series].
- U.S. Department of Agriculture, Agricultural Marketing Service. (2026b). Dairy Market News: Whey protein concentrate 34%, Central and West [Weekly data series].
- U.S. Department of Agriculture, National Agricultural Statistics Service. (2026). Milk production [Monthly data series].
- U.S. International Trade Commission. (2022). U.S. infant formula shortage and supply and trade (Executive Briefings on Trade). https://www.govinfo.gov/content/pkg/GOVPUB-ITC1-PURL-gpo191177/pdf/GOVPUB-ITC1-PURL-gpo191177.pdf
- Wisconsin Department of Agriculture, Trade and Consumer Protection. (2025). International Agribusiness Center export highlights: First quarter 2025. https://datcp.wi.gov/Documents2/IABC%20Export%20Highlights%20Q1%202025%20Final.pdf