Brief Update on Federal Milk Marketing Order (FMMO) Hearing Progress
USDA’s recommended decision from the FMMO hearing process was published July 15, 2024 in the Federal Register. The deadline for comments on this recommendation is September 13, 2024. USDA is under ex parte until a final decision is published. This action places us at the 6th step in the process laid out below:
- USDA receives proposal;
- USDA issues an Action Plan and Request for Additional Proposals;
- USDA issues a Notice of Hearing, and ex parte begins;
- USDA holds a public hearing;
- USDA issues a recommended decision (Proposed Rule);
- Opportunity for the public to submit comments; the deadline for comments is September 13, 2024;
- USDA issues a final decision, and ex parte ends;
- Affected producers vote on whether to accept the provisions of the Order, in an all or nothing vote;
- USDA determines producer approval;
- USDA issues a final rule or termination of proceeding;
- USDA implements the order (if approved by producers).
Dairy Market Update
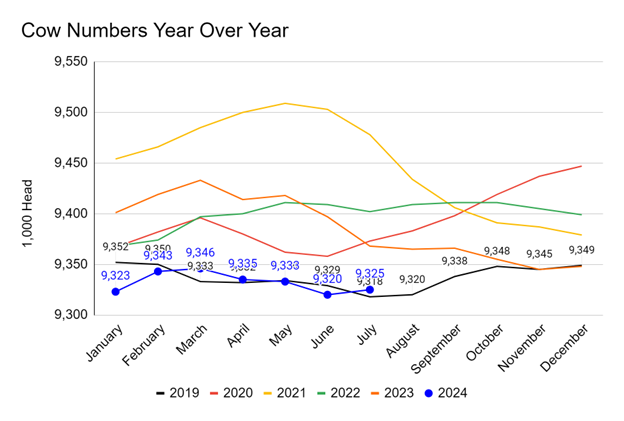
The US Milk market has a recent report from the United States Department of Agriculture, National Agricultural Statistics Service (NASS) with updated cow numbers to 9.325 million for July 2024 (Figure 1). Despite a month-over-month increase of approximately 5,000 head from June 2024, the year-over-year change in cow numbers shows a decrease of 43,000 head for July 2024 compared to July 2023. Thus despite a monthly increase in cow numbers with 0.05% the year over year decline remained (-0.46%) as of July 2024.
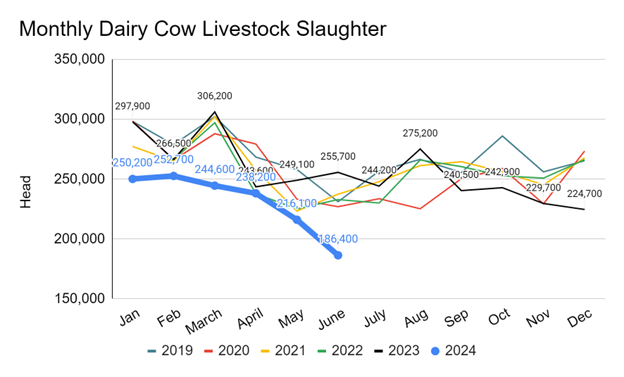
The Livestock Slaughter report by NASS shows that the number of dairy cows slaughtered in June 2024 was 186,400 head (Figure 2). This represents a decline of 69,300 head compared to the 255,700 head slaughtered during the same period in 2023. It’s expected that producers are optimizing their animal inventory at all ages and keeping cows longer on the farm. As evident from month-over-month decline of (-13.70%) followed with a year-over-year decline of (-27.10%) as of June 2024.
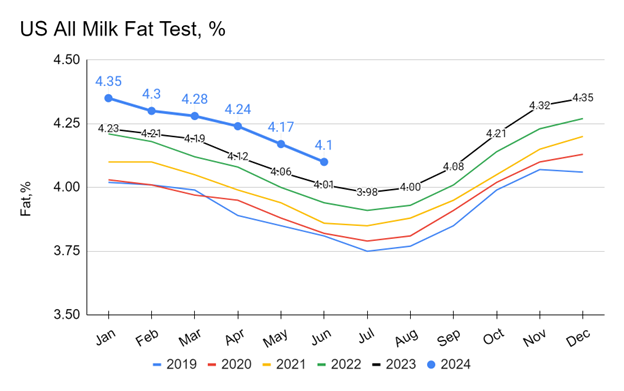
The monthly average fat test, according to USDA NASS data, rose from 4.01% in June 2023 to 4.10% in June 2024 (Figure 3). Despite an expected seasonal month-over-month decline of (-0.07%), there is an increase of 0.09% compared to the previous year.
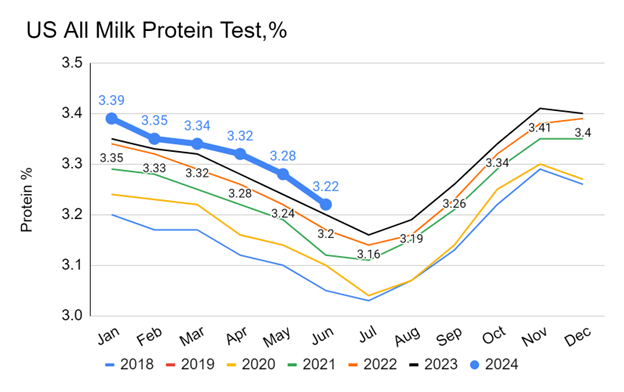
Similarly, milk protein test values have been on a year-over-year rise, averaging 3.17% in 2022, 3.20% in 2023, and 3.22% in July 2024 (Figure 4). There is an increase of approximately 0.02% as of June 2024 compared to the same period in the previous year. Thus, the year-to-date percentage of change remained approximately 0.91% as of June 2024 compared to previous year over the same period of time.
The national dairy herd has consistently increased its milk components on a year-over-year basis, as measured monthly. This rise in solids production has moderated the expected supply responses that typically accompany a reduction in cow numbers. There is currently no indication that this trend of increased solids production will abate. The year 2024 is on track to continue setting new monthly records for all upcoming months.
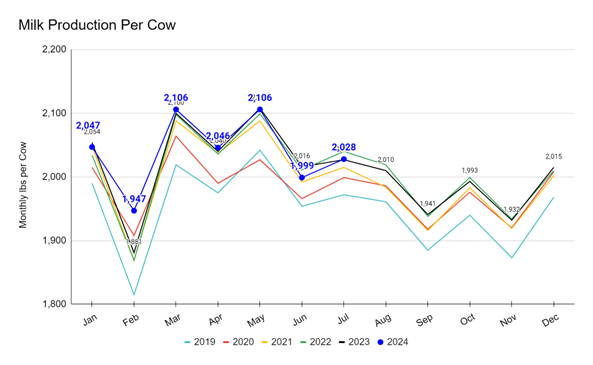
The US dairy herd had an average monthly milk production per cow of 2,028 pounds in July 2024 (Figure 5).There is a year-to-date increase of 53 pounds with a percentage increase of 0.05%. There was a gradually increasing trend in month-over-month milk production with 29 pounds with a percentage increase of approximately 1.45% as of July 2024. Similarly there was also an increase of year-over-year milk production with 1 pounds per cow. The percentage increase remained approximately 0.05 % over the same period of time. Thus, there was gradual gain in momentum of average milk production in the US dairy market.
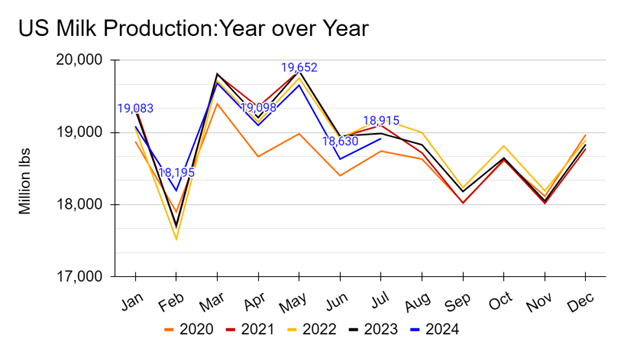
The year-over-year U.S. total monthly milk production is 18.91 million pounds as of July 2024 (Figure 6). This represents a decrease of 70 million pounds compared to the same period in 2023, indicating approximately a -0.37% decline in July 2024.The year-to-date total monthly milk production was also behind -572.0 million lbs with a percentage decline of approximately -0.43% as of July 2024. Despite month-over-month increased milk production of 285.0 million pounds with a percentage increase of 1.53%, the US total monthly milk production is expected to continue declining slightly or, at best, stabilize at lower levels compared to the previous year. If market challenges persist, annual production for 2024 may decrease by 0.3% to 0.5% year-over-year. Moving into the first few quarters of 2025, the market may begin to adjust, with production levels potentially stabilizing or slightly increasing.
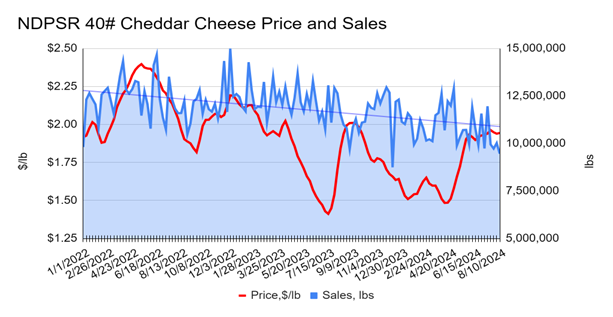
The National Dairy Products Sales Report (NDPSR) from the USDA Agricultural Marketing Service (AMS) provides weekly insights into dairy market trends. In June 2024, cheddar cheese prices stabilized just below $2.00 per pound after earlier fluctuations (Figure 7), though they remain lower than mid-2022 levels. Sales volumes also showed a slight decline compared to June 2023, settling around 10 million pounds. Month-over-month, May 2024 saw an increase in both prices and sales volumes, but June showed stabilization with slight declines. The market appears to be leveling off, with cautious demand influencing both pricing and sales trends.
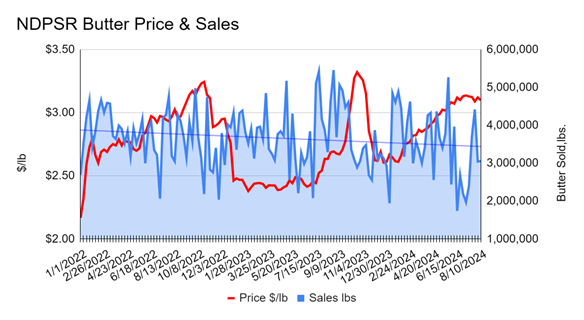
The NDPSR data provides insights into the butter market , reflecting both price and sales trends (Figure 8). The 2024 butter market has experienced fluctuations in both price and sales volumes. Early in the year, butter prices experienced a decline, reaching a low around mid-2023. This period was marked by significant volatility in sales, as evidenced by the wide swings in butter sold. However, moving into 2024, butter prices have shown signs of recovery, stabilizing around the $2.75-$3.00 per pound range. Concurrently, sales volumes have remained robust, with consistent figures approaching 4 to 5 million pounds. This stability in price and sales suggests consistent demand, particularly domestically.
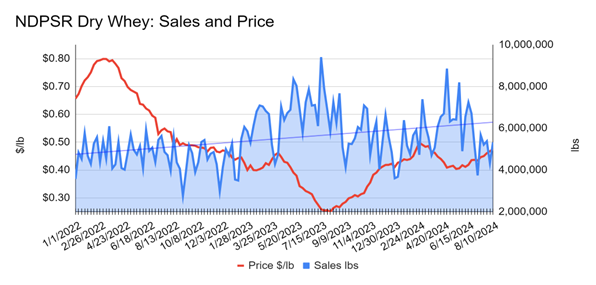
As of June 2024, the U.S. dry whey market is experiencing a gradual recovery in prices after a period of weakness. The price of dry whey has increased slightly to around $0.44 per pound (Figure 9), reflecting a modest rise from earlier in the year. This increase is part of a broader trend where key dairy product prices, including Cheddar cheese and butter, have also seen upward adjustments due to tighter supplies and steady demand.
Despite these gains, the overall market remains cautious. Supply constraints in some regions, particularly due to maintenance at drying facilities, have limited availability, which has contributed to the firmer prices. However, domestic demand is still relatively stable, and there hasn’t been a significant surge in purchasing activity, suggesting that the market is slowly finding its equilibrium. Overall, the dry whey market in June 2024 shows signs of recovery, with prices stabilizing at slightly higher levels, but the market’s future direction will depend on how supply and demand dynamics evolve in the coming months.
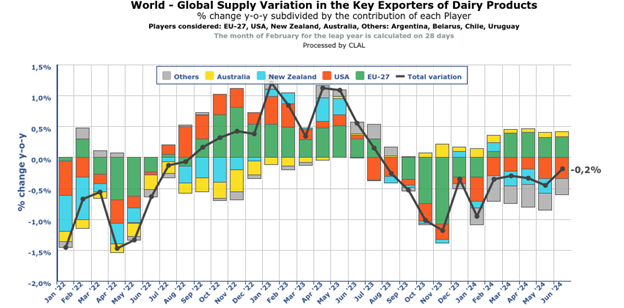
When looking at the data for “Global Supply Variation in the Key Exporters of Dairy Products” by CLAL for June 2024, the USA’s variation in supply is negative. They clock in the year-over-year reduction in dairy supply from the United States is approximately -(0.2)% as of June 2024 (Figure 10).
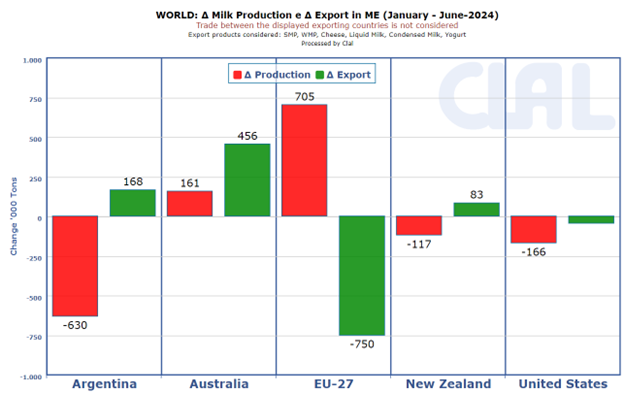
Currently, the US dairy market is still facing a competitive export environment. US milk production and export market comprising the exports of cheese, fluid milk, condensed milk, yogurt, SMP, and WMP has its statistics for January-June, 2024 out by CLAL in which (Figure 8) the U.S. dairy market experienced a slight decline in milk production by 166,000 tons during the first half of 2024. Despite this reduction in production, U.S. dairy exports showed stability, with a minimal increase. This trend suggests that while domestic production faced some challenges, the U.S. was able to maintain its export levels, indicating supportive international demand and the ability of the U.S. dairy sector to continue supplying global markets effectively.
In Summary: August 2024
Prices have remained stable and are expected to continue this trend into the fall and the rest of the year. Butter prices, along with slightly constrained milk supplies, have contributed to supporting farm-level prices. Although demand remains steady but unremarkable both domestically and internationally, it continues to absorb market supply. However, any decline in demand or increase in milk supply could exert downward pressure on prices as we move into the early part of 2025.