State Level Overview
2025 End of Year Report
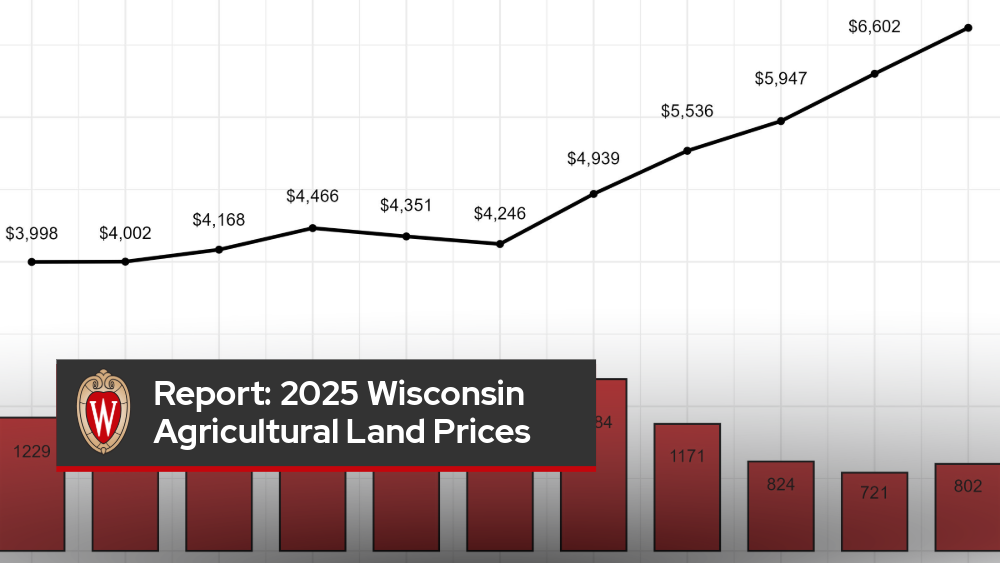
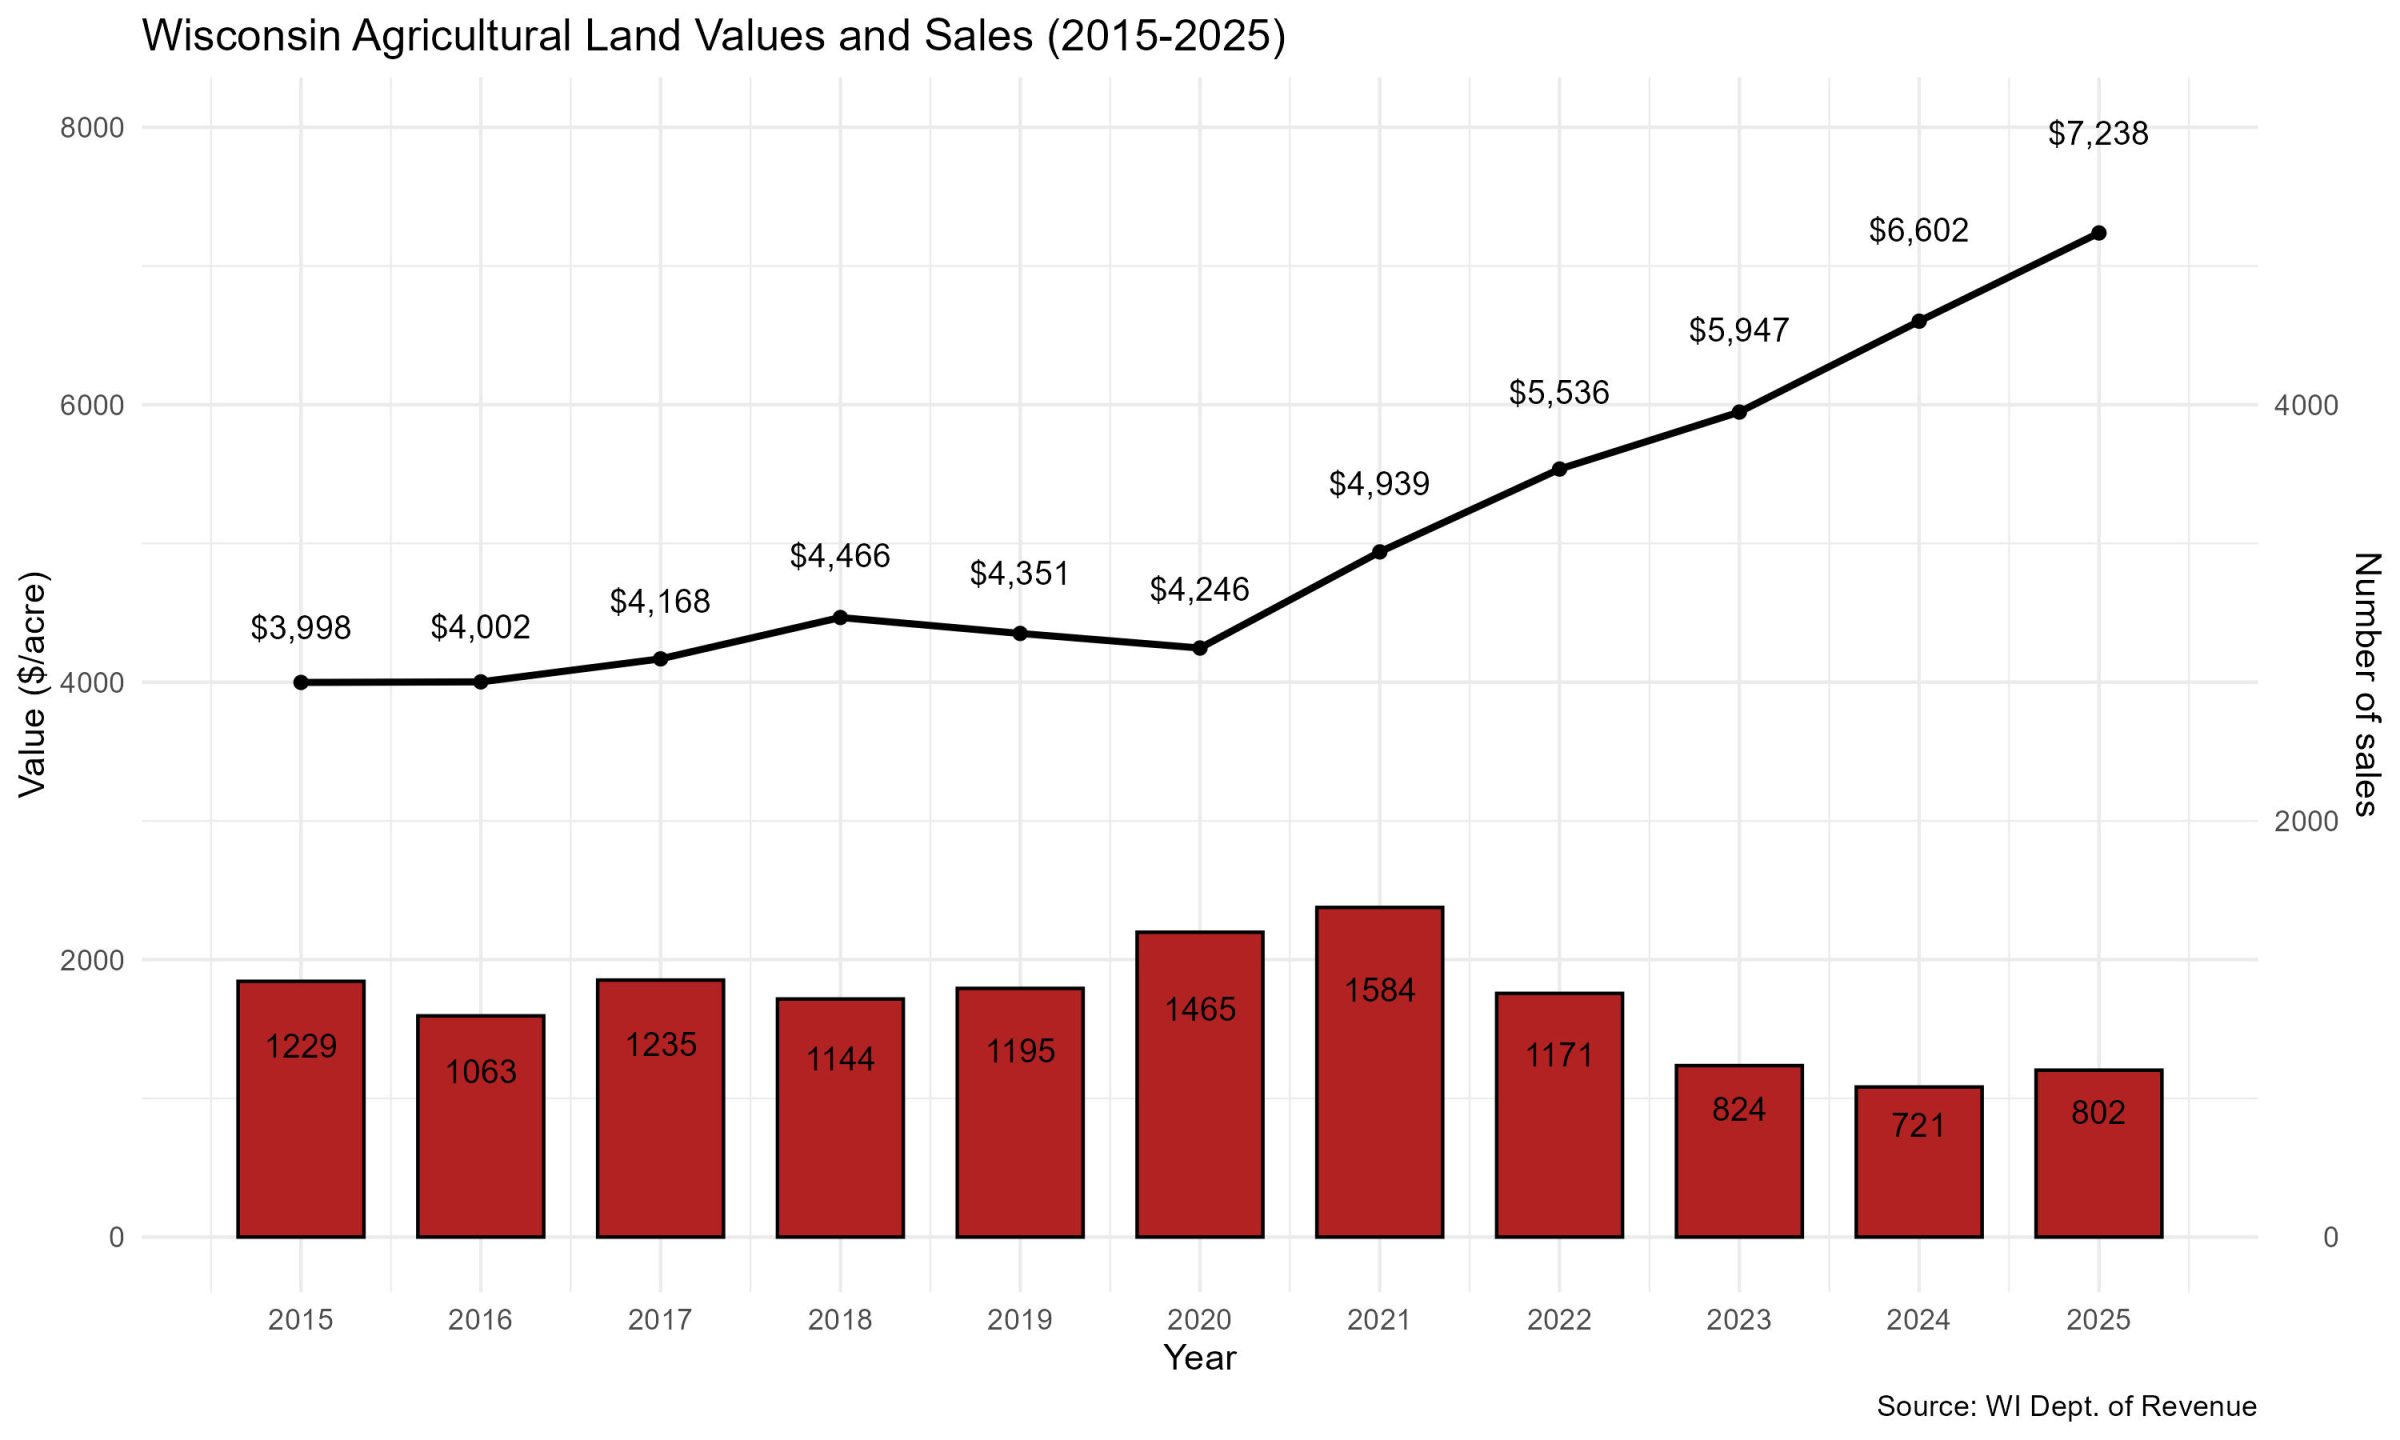
The average price of agricultural land sold in Wisconsin between January 1 and December 31, 2025, was $7,238 per acre (see Figure 1), representing a 9.6% increase from 2024. From 2020 to 2025, land values increased by 70.5%, with the most significant gain occurring between 2020 and 2021, when prices rose by 16.3%.
The number of land sales in 2025 increased by 11.2% from 2024, marking the first upward trend since 2022. Despite this increase, sales activity remains below the levels observed in 2020 and 2021, when land sales peaked. Compared with 2018 pre–COVID-19 levels, the number of land sales in 2025 declined by 29.9%.
There are marked differences in sale prices across the state, with some regions commanding higher prices than others. Despite challenging economic conditions and substantial losses in the number of dairy farms over the past several years, the land market has remained relatively strong due to landowners’ ability to retain their property and limit the supply of land available for sale. During the COVID period, many farms that were already nearing retirement or facing financial stress chose to exit the industry and sell their land. Most remaining landowners, including those who have exited dairy production, have not been forced to sell and have instead continued to crop or rent their land. This tightening of the available supply has strengthened sellers’ market power and supported higher land values. In some areas, additional factors, such as urban sprawl, alternative energy, and data centers, have further contributed to maintaining or even increasing land prices.
Farmland is the most valuable asset on most farmers’ balance sheets. However, estimating land values is always tricky. Each parcel of land is unique. While many thousands of homes are sold yearly, only a tiny fraction of the state’s agricultural land changes hands on the open market in any given year.
Surveys of farmers, bankers, real estate professionals, and appraisers are sometimes used to estimate changes in land values. While easy to conduct, these opinion surveys are subjective and can be hard to interpret. News of high-priced sales travels quickly, but such sales are often exceptions and do not reflect the market.
The Wisconsin Department of Revenue (DOR) collects alternative agricultural land sales data. When a property is sold, a transfer return tax is collected, and a transfer return form is filed with the tax payment. Data from these transfer return forms are used in this paper.
Wisconsin’s agricultural land values are lower than those of some of our highly productive neighboring states. This is because a large portion of our land is unsuitable for continuous row crop farming and is used for forage production, woodlots, and pasture. The shorter growing season in northern Wisconsin also limits the land’s agricultural potential.
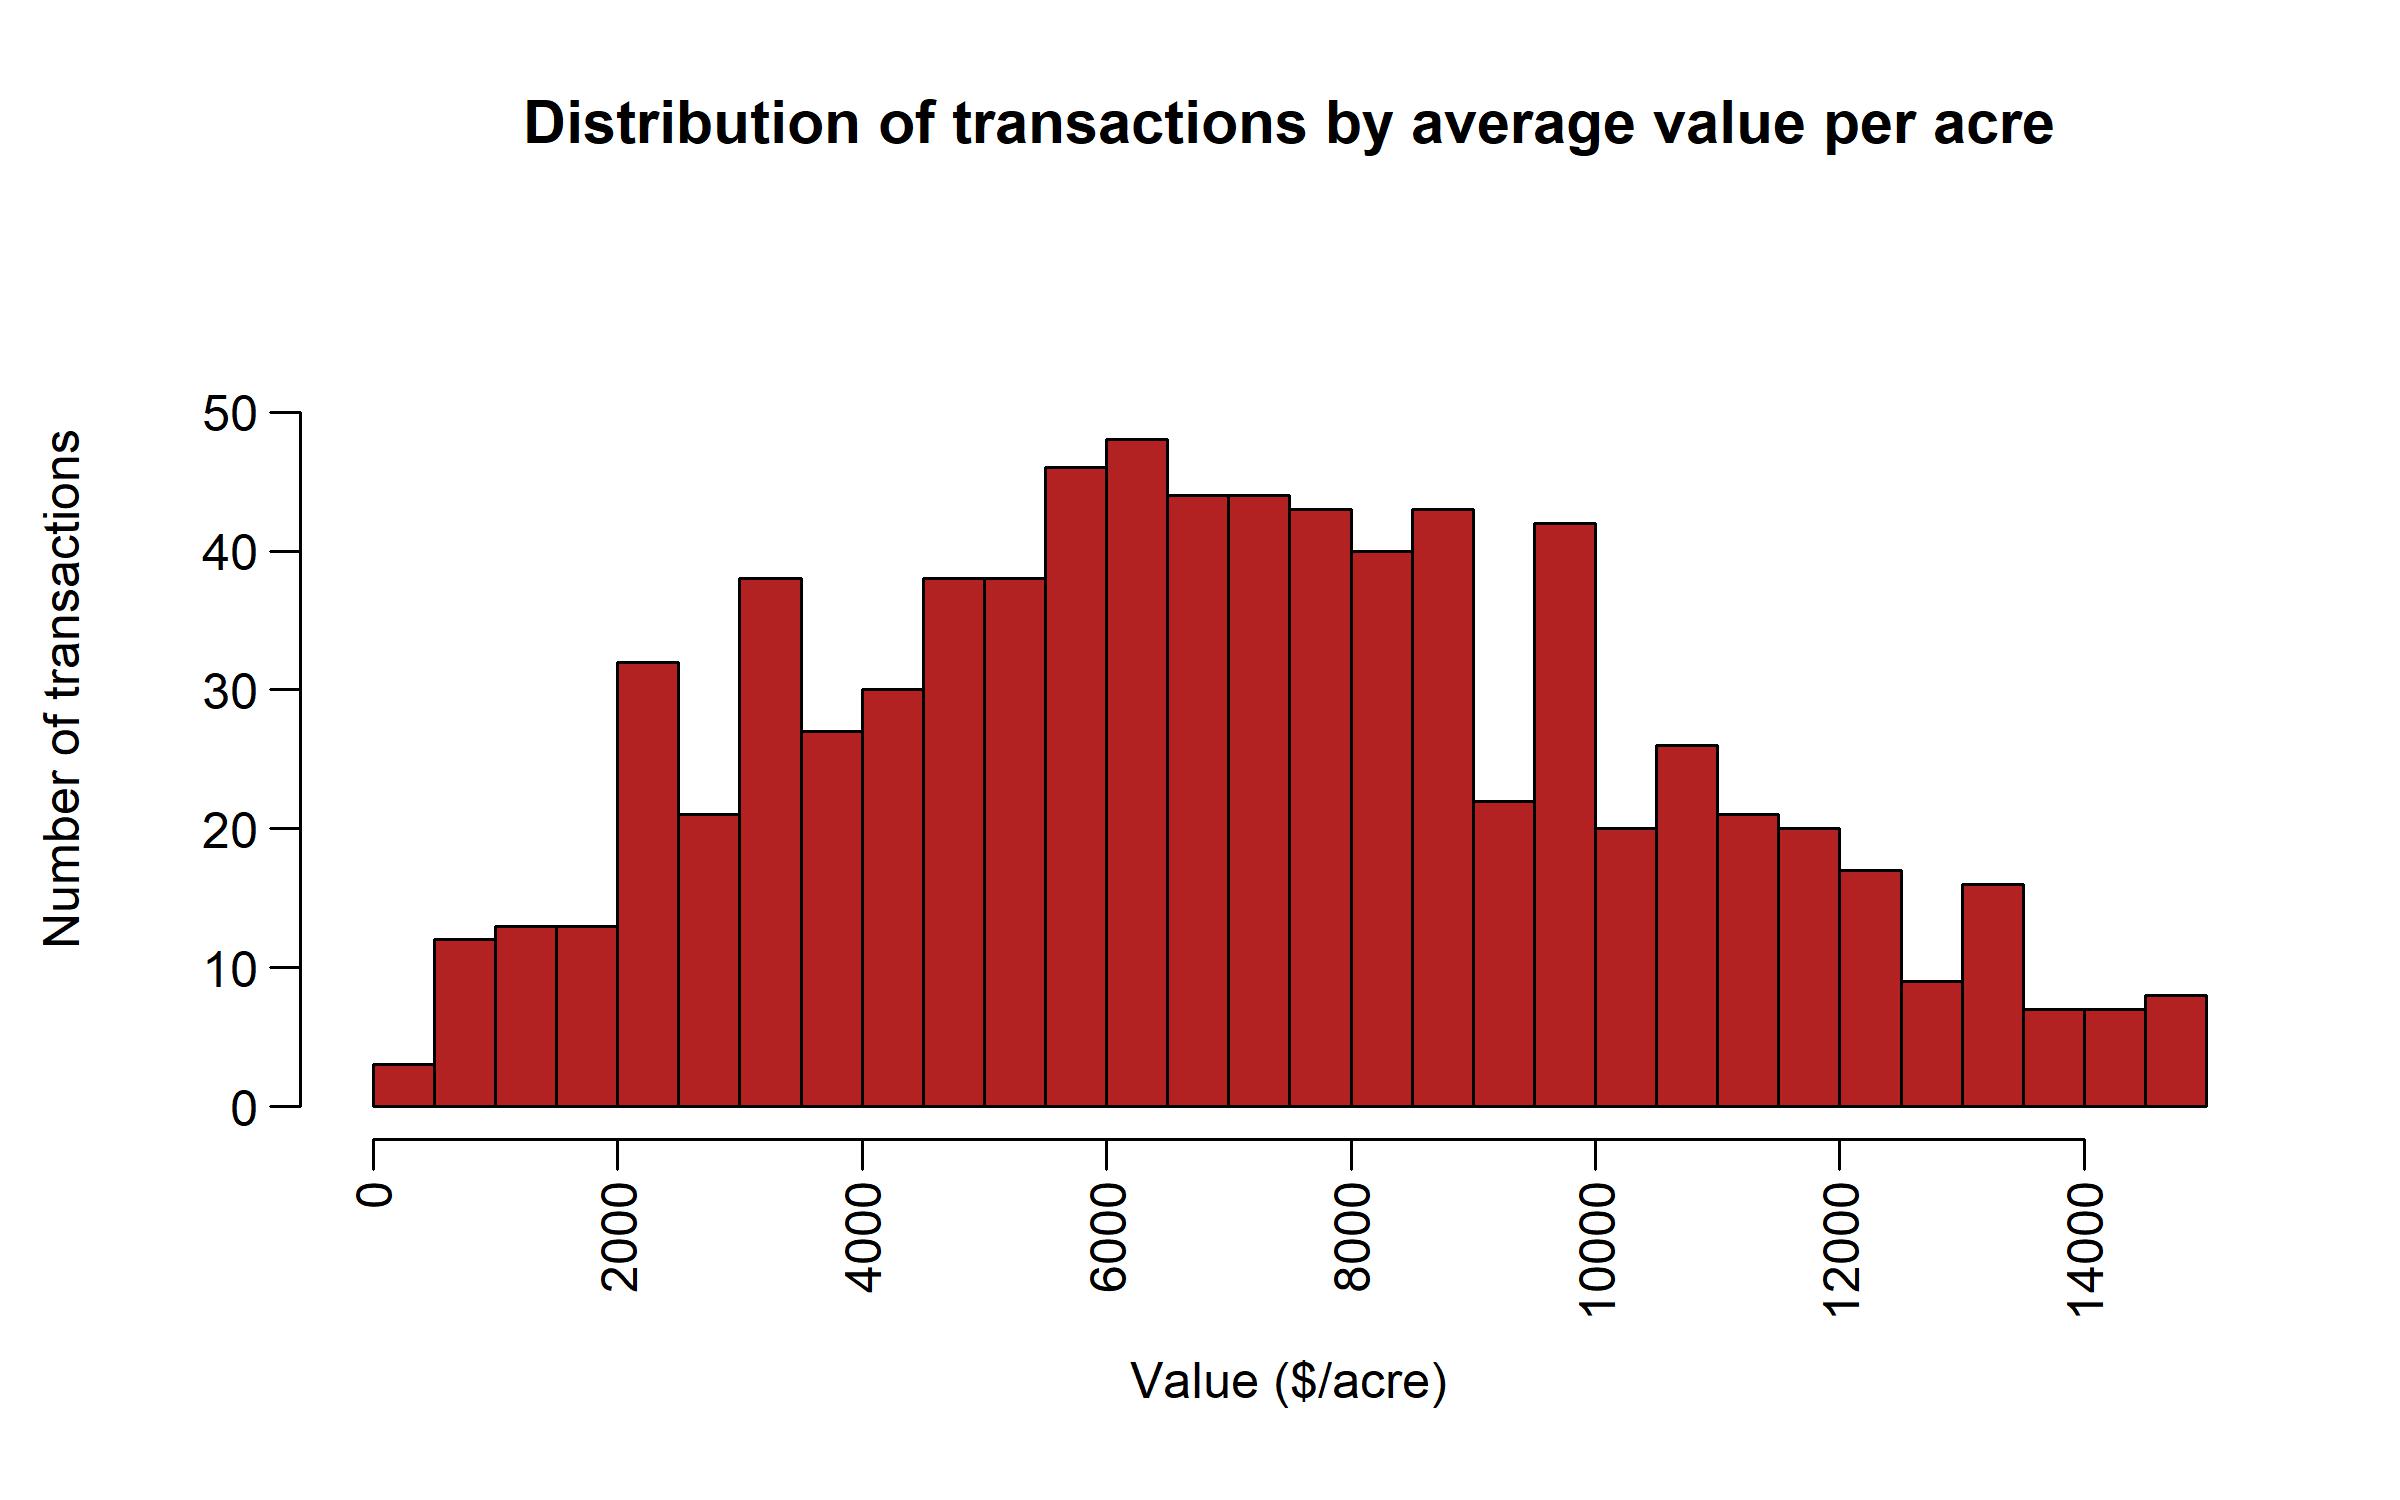
While the state average has increased for 2025, there is wide variation in the sales price per acre. 18.7% of sales were less than $4,000/acre, 20.6% were above $10,000/acre, and 60.7% were between $4,000 and $10,000/acre. High-priced sales make good headlines; however, there were very few sales above $11,966/acre (10% of all transactions) (see Figure 2).
Another way to emphasize the wide range in prices paid for agricultural land is illustrated in Appendix Table 1. Appendix Table 1 reports the minimum, average, and maximum sale price/acre for each county between 2015 and 2025.
Methodology
This statewide report is based on bare land sales between non-related parties in Wisconsin townships. All parcels ranged from 35 to 2,000 acres, and their predominant use at the time of sale was agriculture. Properties with waterfrontage or managed forest acreage were filtered out. Parcels sold with retained property rights or with miscellaneous use notes referring to mining were also excluded.
The Department of Revenue’s transfer return data is an objective, relatively timely source for measuring changes in agricultural land values over time. Towards the end of every year, the Wisconsin Agricultural Statistics Service posts a summary of agricultural land sales – both bare land and improved properties. The National Agricultural Statistics Service (NASS) uses the same transfer return data as this study. The delay in the publication of the summary document allows county assessors to collect and verify each parcel’s intended future use. This means that some of the parcels included in our analysis may later be eliminated from the NASS summary because they are no longer being used in production agriculture.
There are a few other differences in our approaches. The NASS summary is not limited to parcels of 35 acres or more and includes properties in cities and villages. Using only the transfer return data enables us to assess the direction of land values earlier. The NASS reports (typically updated in late summer) are another good alternative, providing more information on tillable land and land diverted from agriculture. The link to obtain the most current land summary is: http://www.nass.usda.gov/Statistics_by_State/Wisconsin/Publications/Land_Sales/.
Sales Based on Location
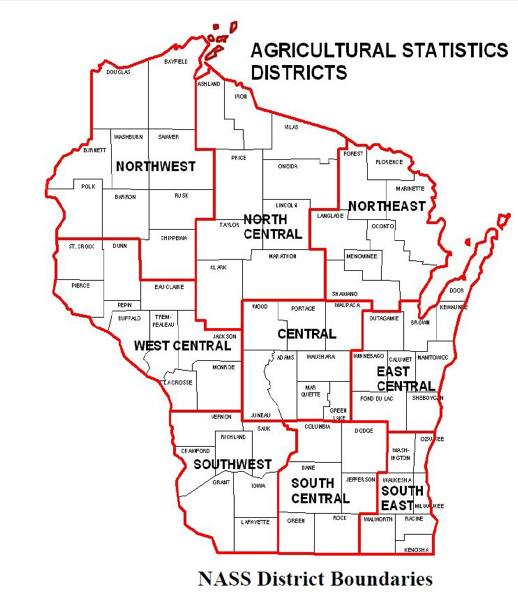
Location is an important determinant of value. In addition to the state-wide averages, land prices are reported using NASS districts. The map below displays the borders of the various districts.
Table 1 below contains the average price ($/acre) in the nine NASS reporting districts. Appendix Table 1 has a complete listing of minimum, average, and maximum sale prices by county. There are often wide variations in the value of individual parcels even within the same township or county due to soil, quality, topography, drainage, and proximity to urban centers. From Table 1, we can see that the average land value increased in five of the nine reported areas and decreased in four. The highest average prices for agricultural land are in South East, South Central, and East Central Wisconsin, making it difficult to gauge market value trends.
| NASS District | 2015 | 2016 | 2017 | 2018 | 2019 | 2020 | 2021 | 2022 | 2023 | 2024 | 2025 |
|---|---|---|---|---|---|---|---|---|---|---|---|
| Central | $3,093 | $3,060 | $2,999 | $3,607 | $3,431 | $3,526 | $3,949 | $4,084 | $4,281 | $4,956 | $5,901 |
| East Central | $6,805 | $6,412 | $6,145 | $6,847 | $5,959 | $5,797 | $6,355 | $6,805 | $7,396 | $8,839 | $8,599 |
| North Central | $2,554 | $2,910 | $2,560 | $2,933 | $3,084 | $2,640 | $2,842 | $3,167 | $4,229 | $4,085 | $5,205 |
| North East | $3,023 | $2,918 | $3,256 | $3,705 | $3,646 | $3,358 | $3,743 | $4,195 | $5,295 | $5,166 | $6,214 |
| North West | $2,471 | $2,392 | $2,282 | $2,132 | $2,683 | $2,375 | $2,945 | $3,320 | $4,132 | $4,122 | $4,760 |
| South Central | $5,417 | $5,602 | $6,163 | $6,166 | $6,023 | $5,943 | $6,356 | $7,526 | $8,082 | $8,786 | $9,656 |
| South East | $5,775 | $7,009 | $7,243 | $7,690 | $6,765 | $7,411 | $8,474 | $8,341 | $10,327 | $10,199 | $10,420 |
| South West | $3,581 | $3,956 | $3,681 | $4,628 | $4,364 | $4,409 | $5,506 | $6,567 | $6,487 | $8,223 | $7,444 |
| West Central | $3,304 | $3,456 | $3,863 | $3,892 | $3,836 | $3,845 | $4,215 | $4,775 | $5,366 | $6,163 | $6,699 |
Appendix Table 2 provides a more detailed breakdown of real estate sale prices by county. The limited number of sales in each county can cause wide year-to-year variations, and the reported average price may not accurately reflect the local market. These figures should not substitute for an independent appraisal by a qualified professional.
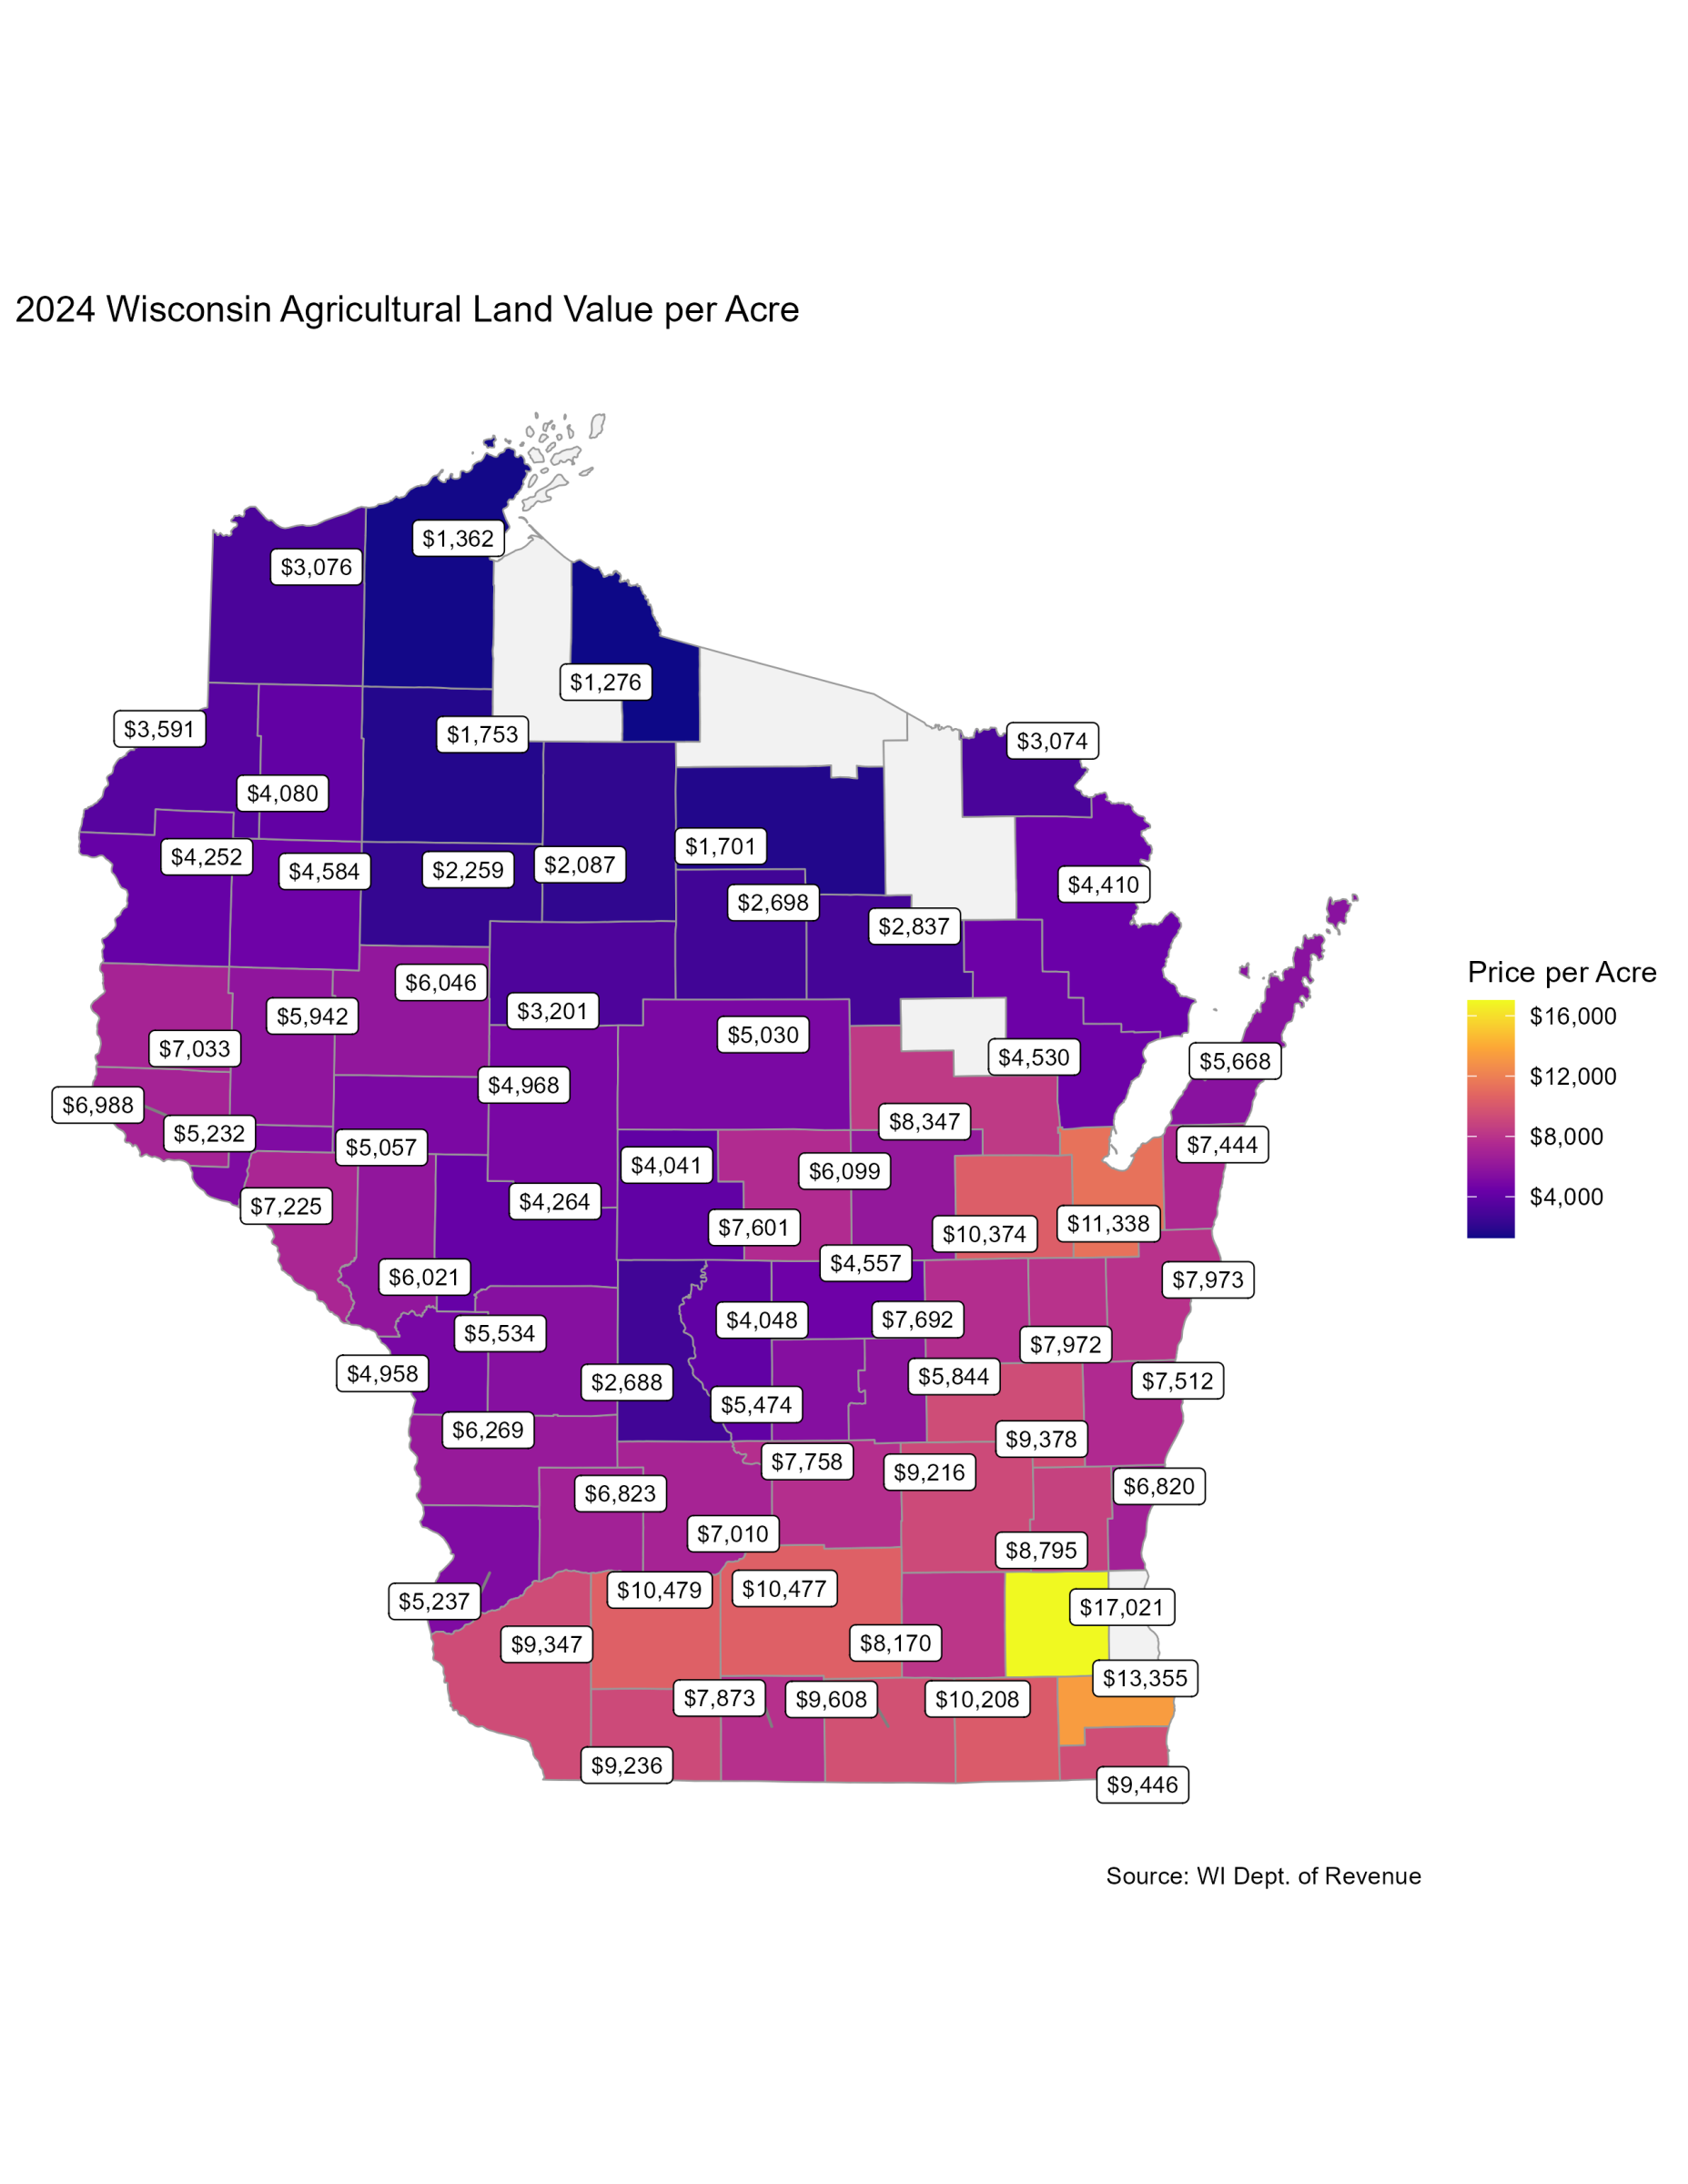
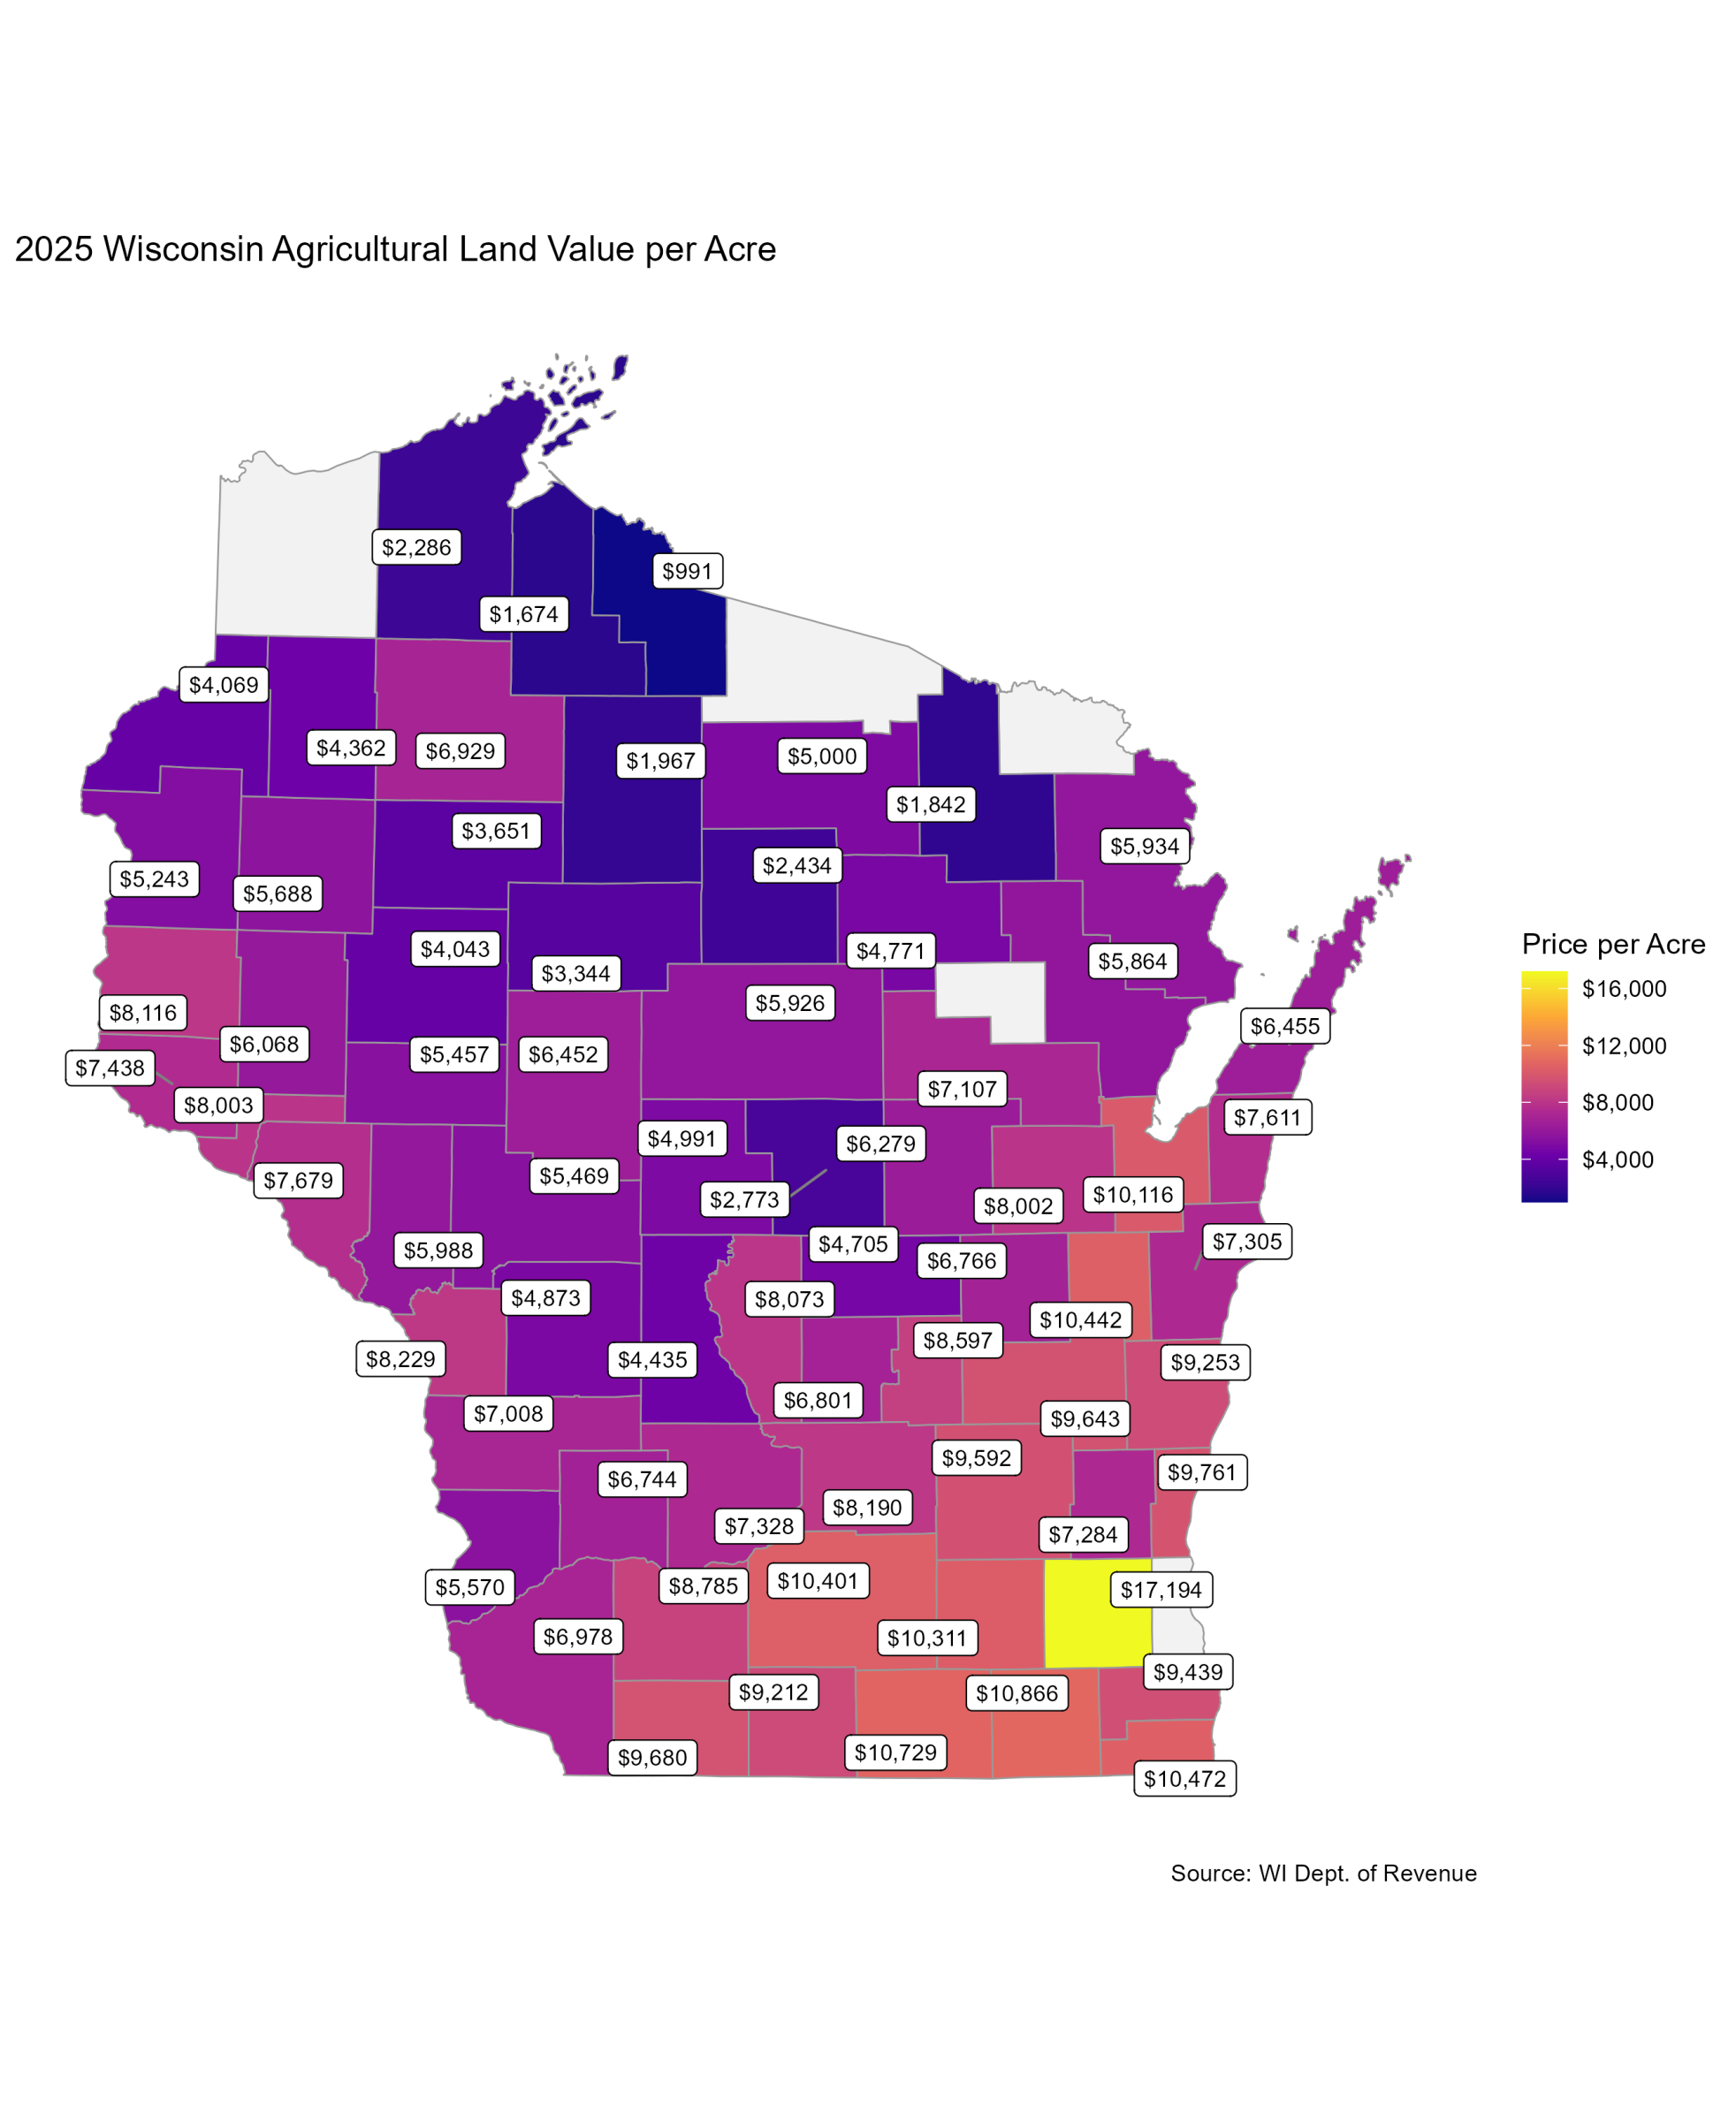
Figure 3 displays the average sales price per acre by county in 2024. Figure 4 displays the average sales prices per county for 2025. Prices are highest in counties with strong dairy and row-crop industries. This is illustrated by the higher prices in the counties along Lake Michigan, the Fox Valley, and Southern Wisconsin.
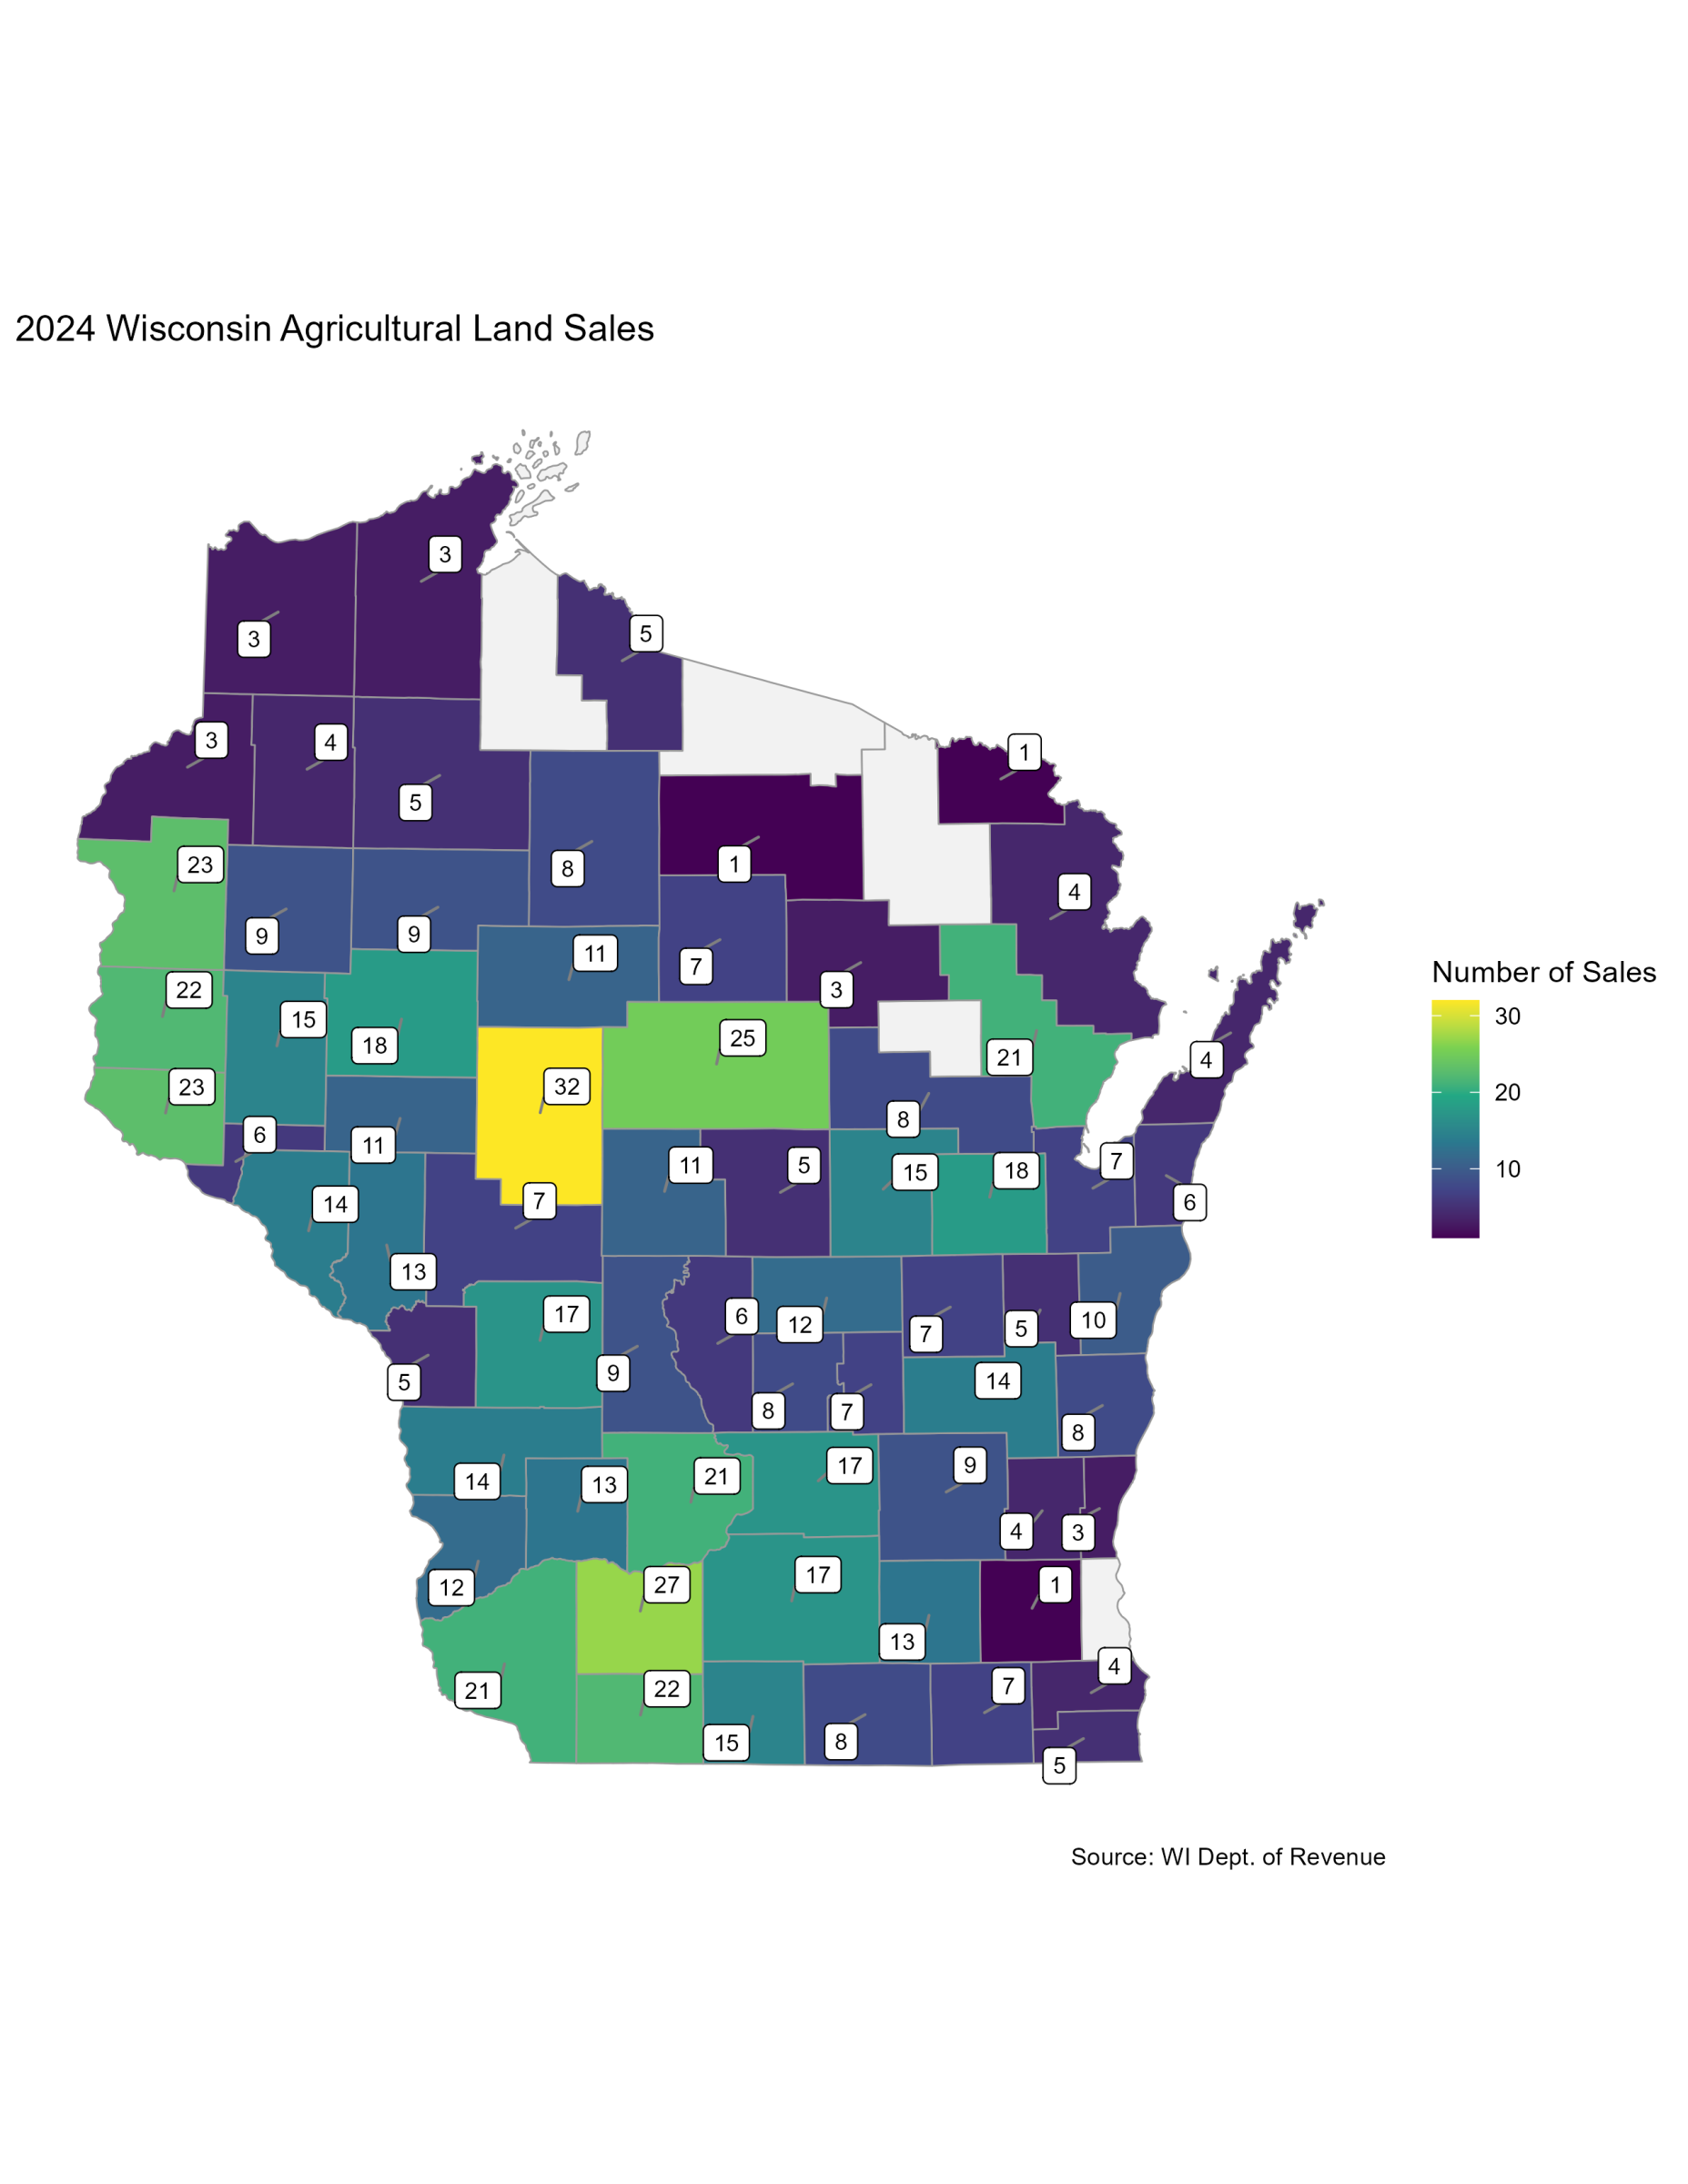
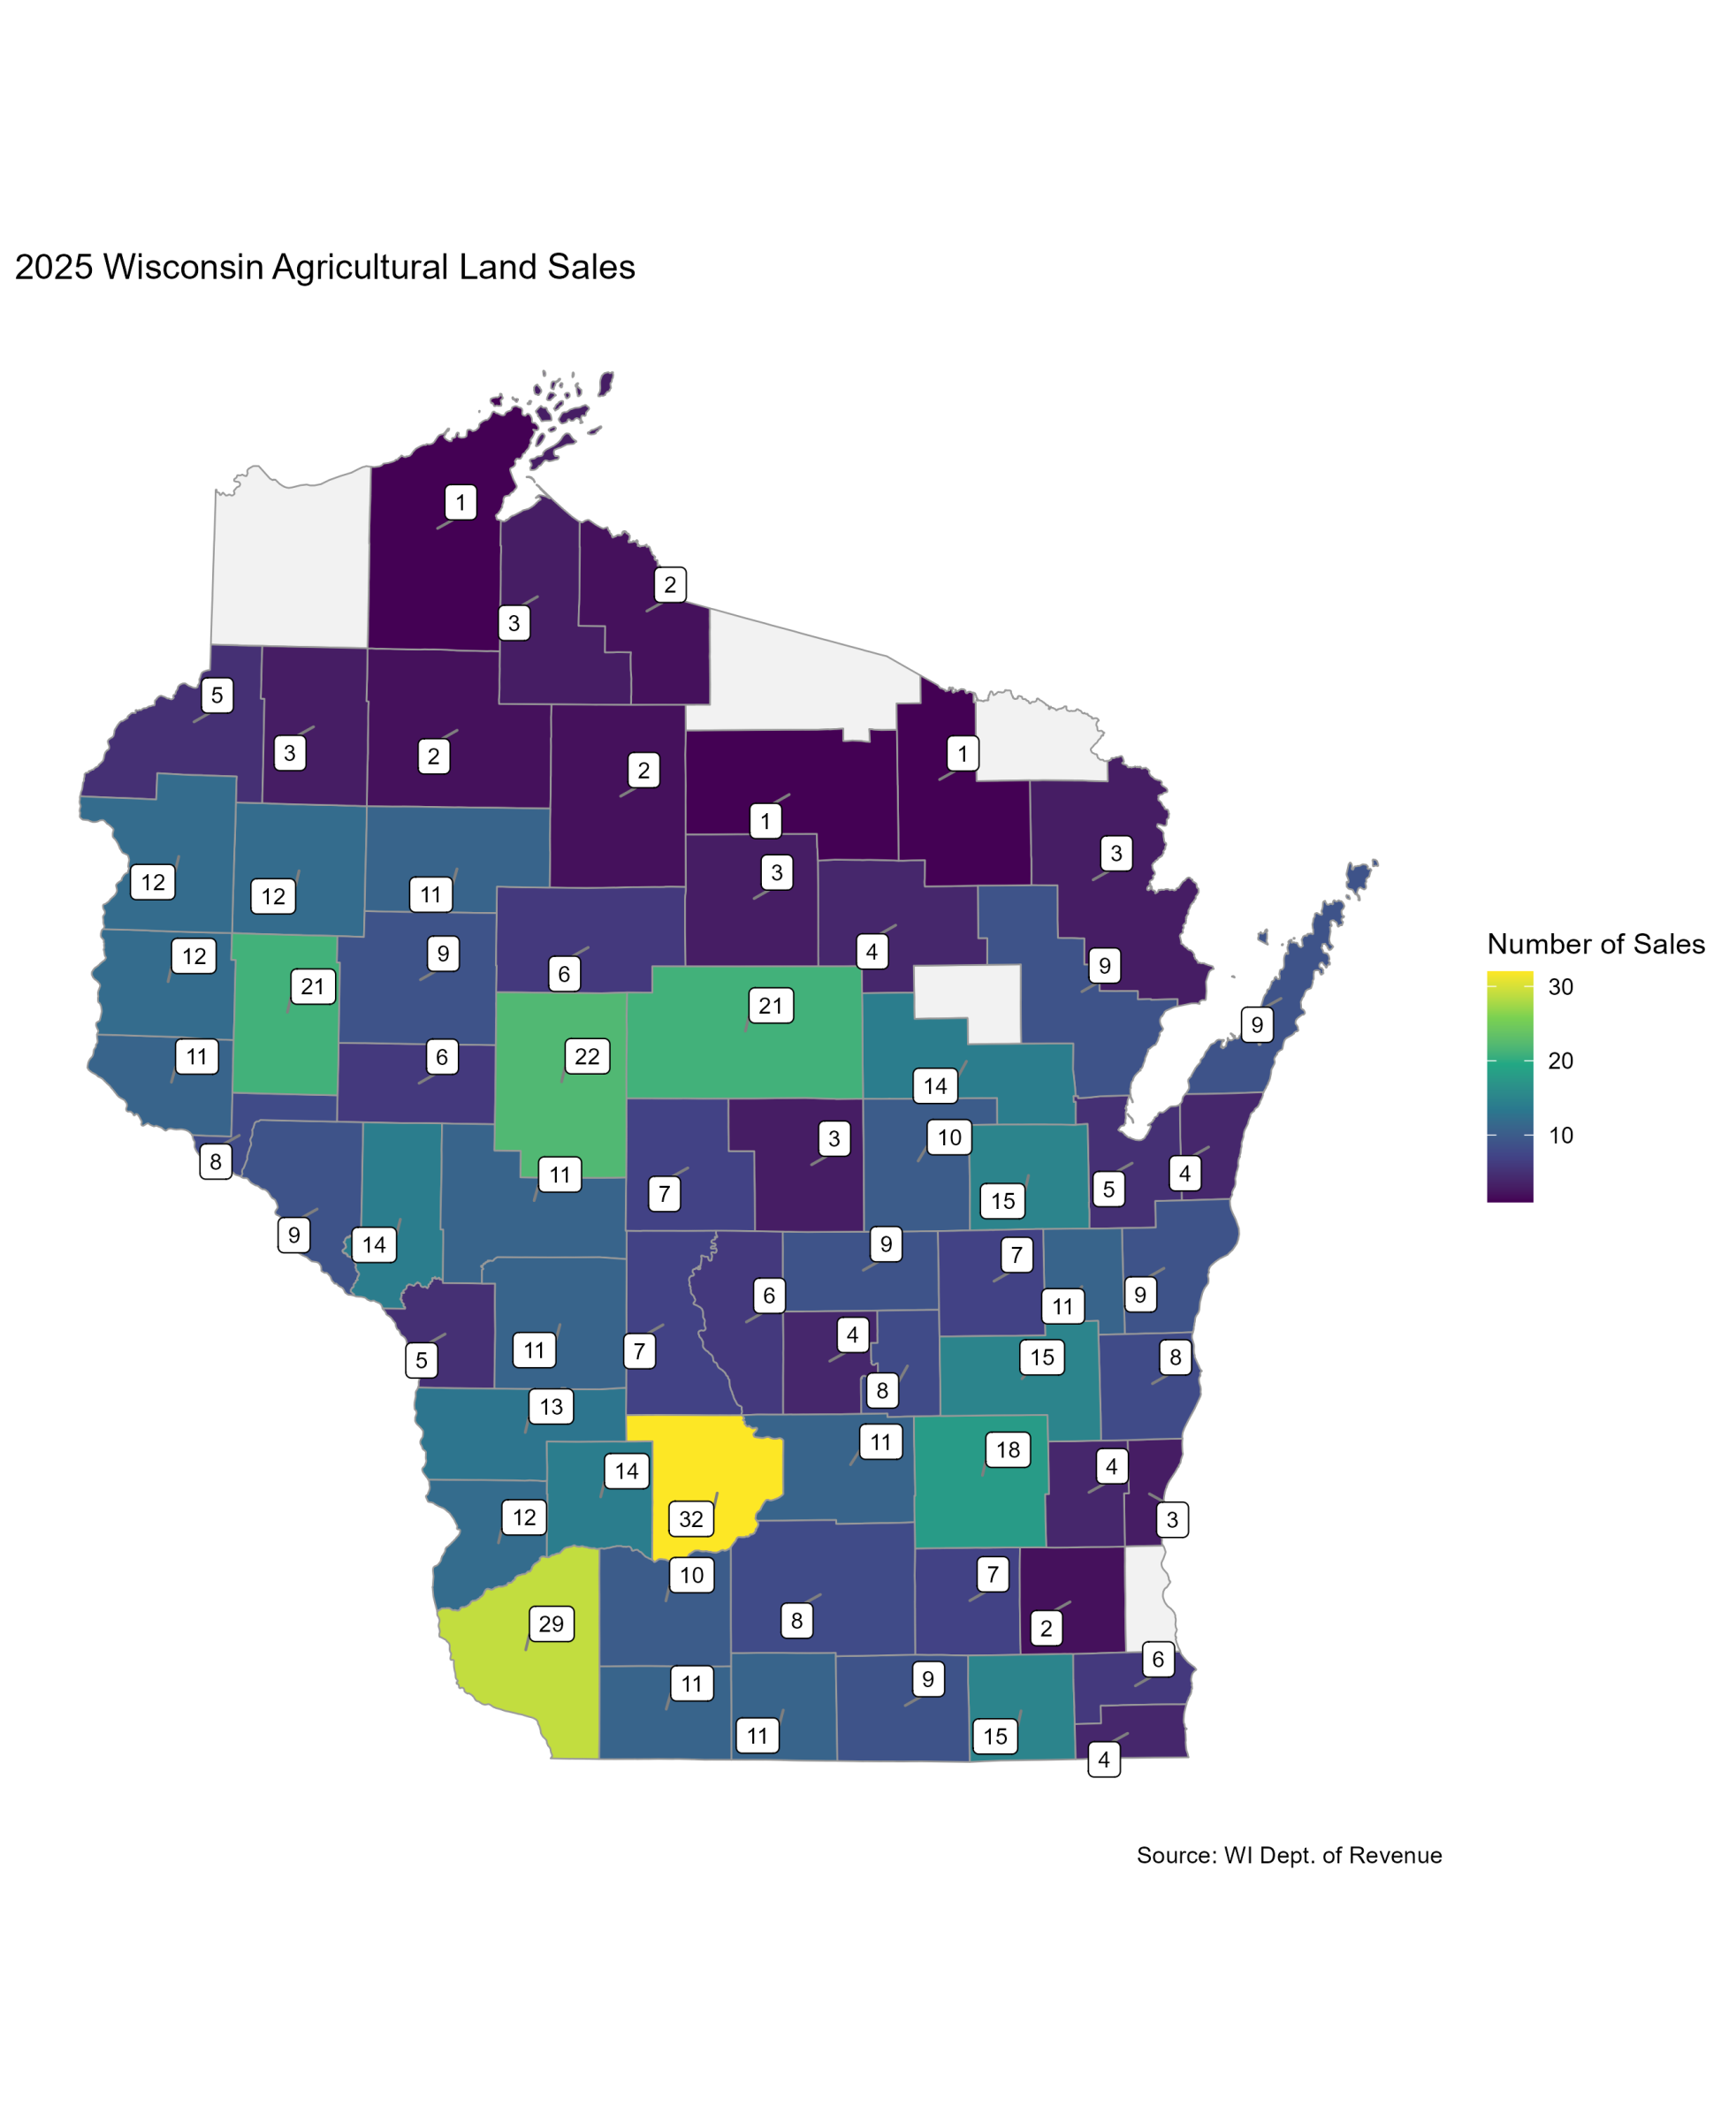
The maps below illustrate the number of sales per county for 2024 and 2025 (Figures 5 and 6, respectively). Figure 5 shows that Clark County led the state in agricultural land sales in 2024, with 32 sales, while Sauk County led the state in agricultural land sales in 2025, with 43 sales (Figure 6). There were relatively few sales in Southeastern WI as urban development pressures have continued to convert land to non-agricultural purposes. We also see few sales in the northern part of the state as the climate and lack of growing degree days make raising crops more difficult in this area.
Land Values vs. Rental Rates
Figure 7 shows non-irrigated cropland rental rates relative to land value from 2015 to 2025. Interestingly, we continue to see a decrease in the capitalization rate (i.e., Rent/Value).
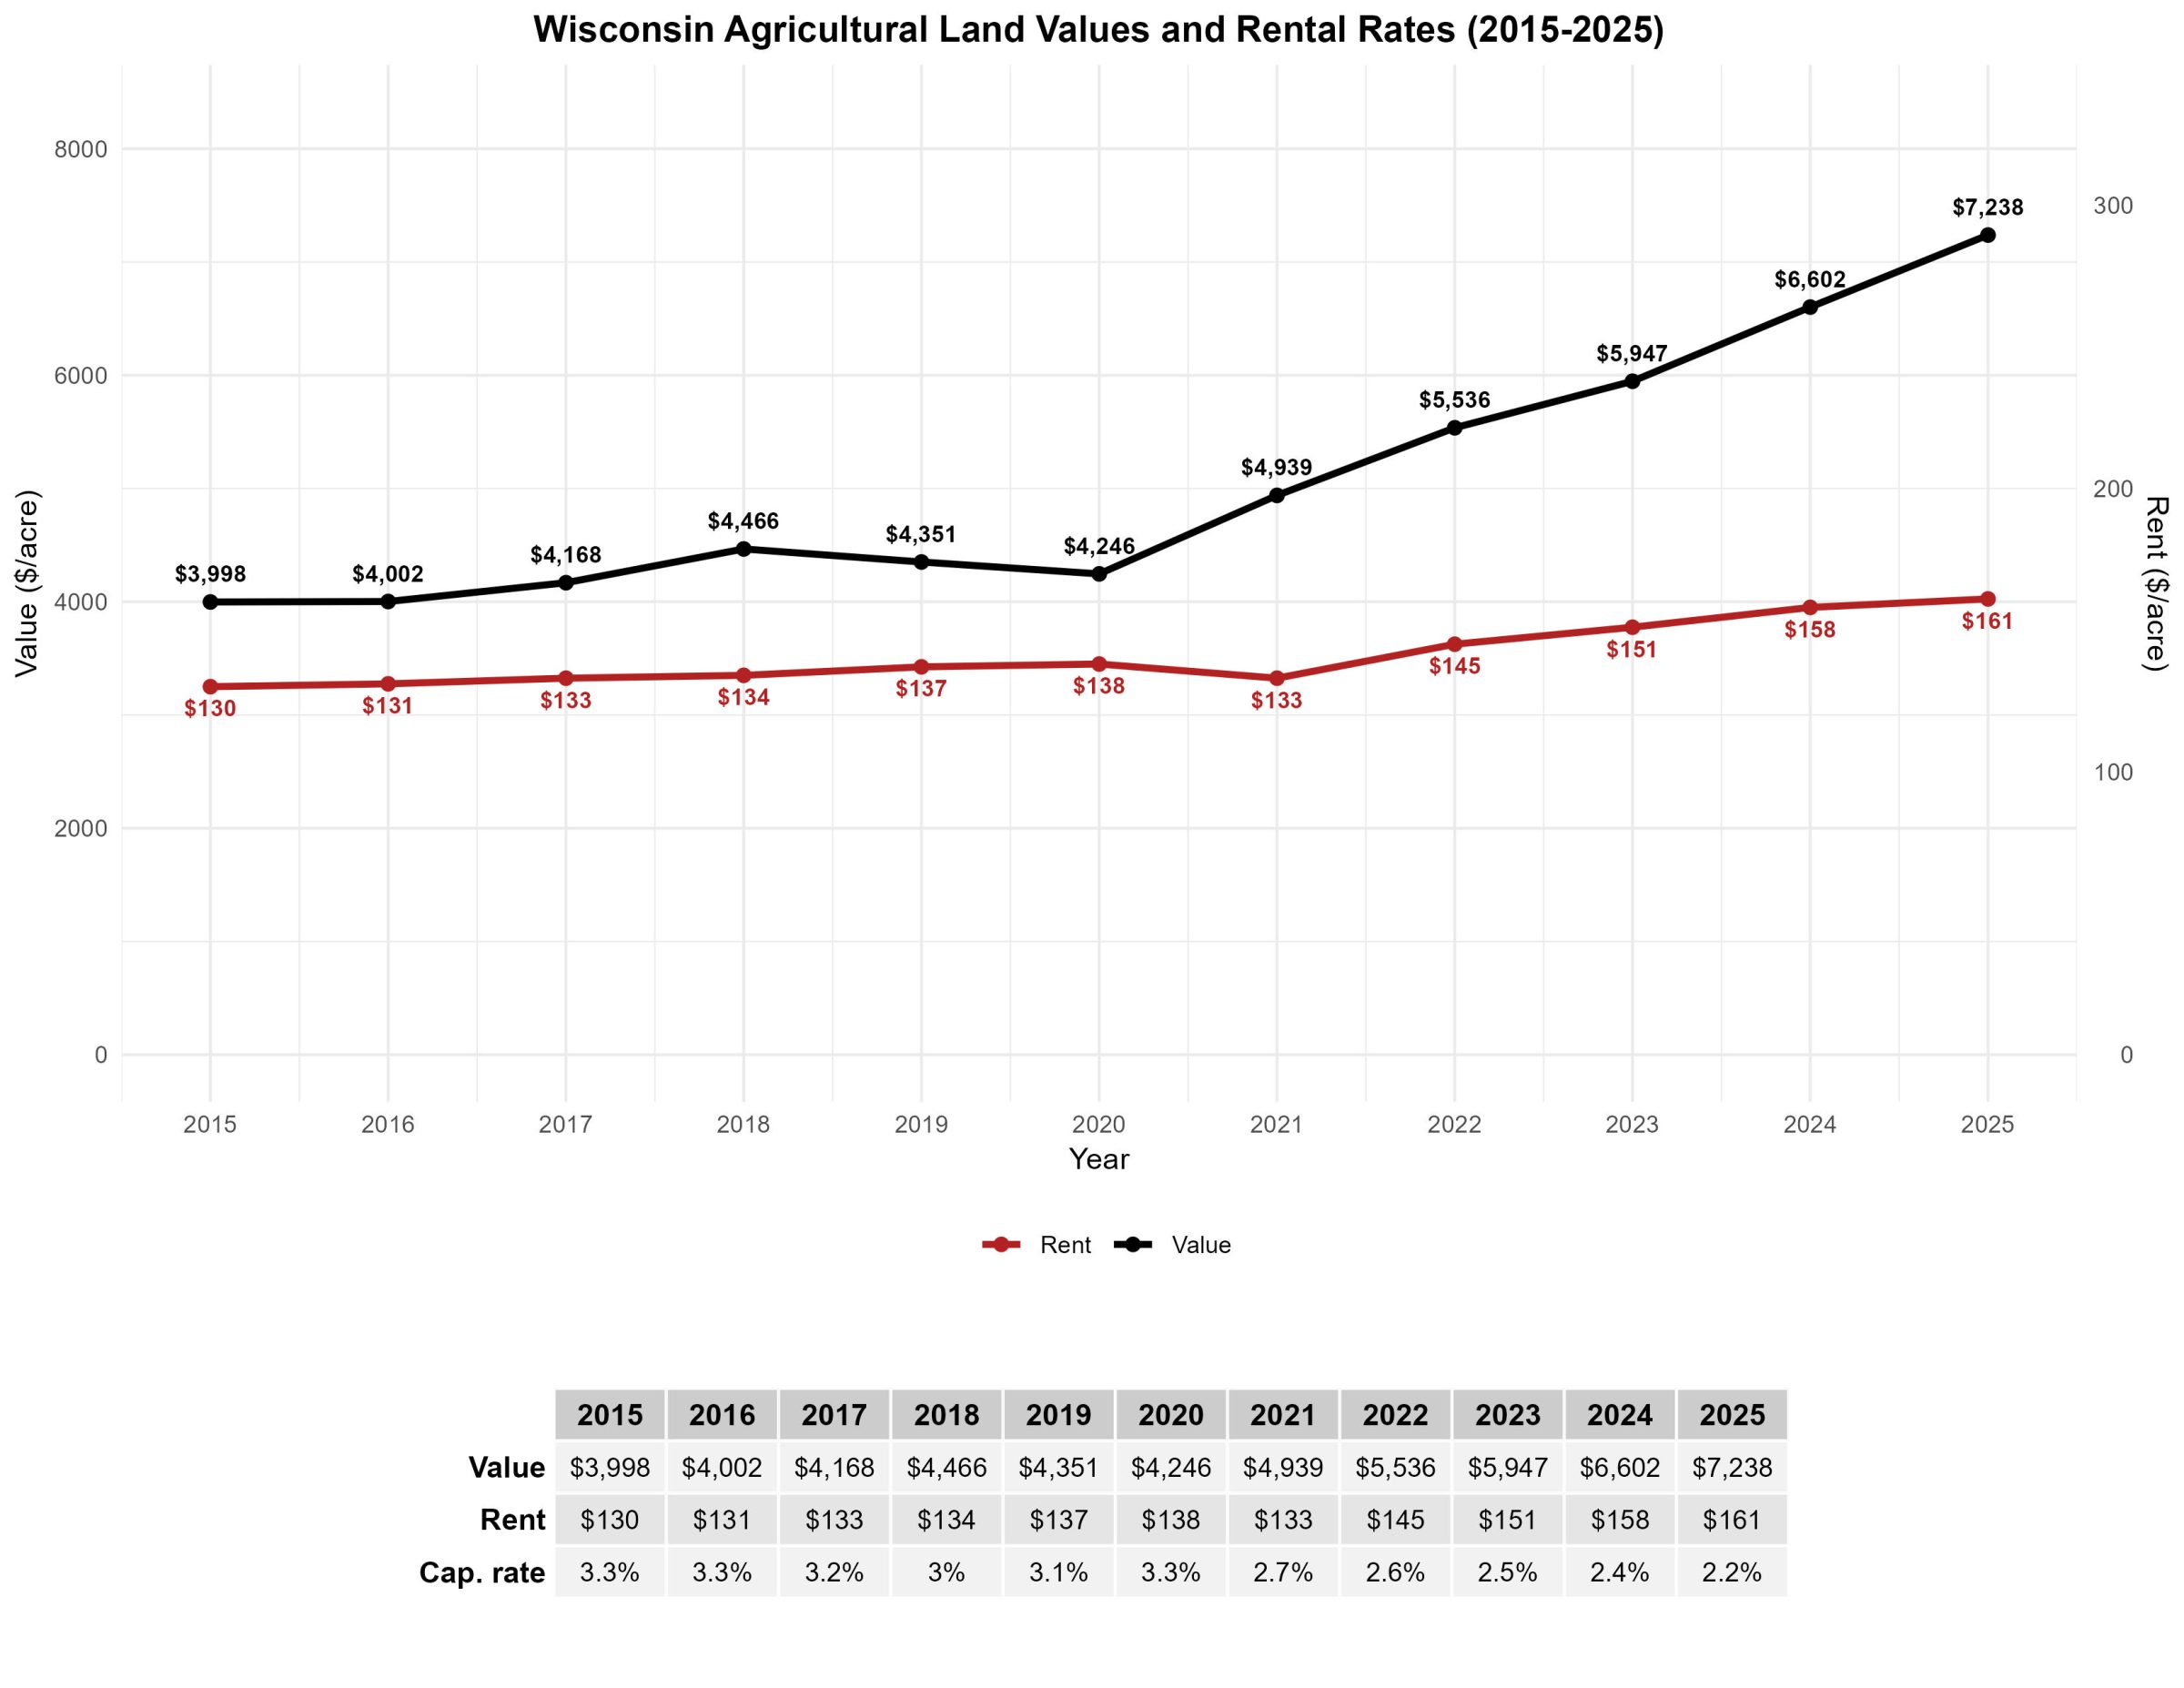
Typically, rent represents about 3% of the land value. Interestingly, since 2021, when land values began to increase, we have seen a decline in the capitalization rate, even as rental rates have risen by 21%. In 2025, the rental rate increased to $161/acre, a $3 increase over 2024 values, but only 2.2% of the land’s value. If we look at the last five years, we see that the average rental rate is 2.48% of the land value. With the last 5 years having a capitalization rate below 3%, it is not surprising that the average is below 3%. It will be interesting to see how long this trend lasts and whether the capitalization rate will continue to decrease, as it has since 2021.
Implications for Agricultural Landowners and Farmers
The appreciation in land value is only realized when the assets are sold. In most cases, the operating agricultural business will not directly benefit from changes in land value. High land values provide the retirement cushion for “last generation” farm businesses. However, high land prices make it more difficult for new entrants to get started without significant help from family members or other financing.
Dairy farms in South Eastern, East Central, and South Central Wisconsin are not only competing with urban sprawl but also with data centers and renewable energy projects. If this trend continues, it will become harder for dairy farms to acquire more land in these areas and may result in a shift away from these parts of Wisconsin to areas where land prices are less competitive.
Wisconsin’s farmland use value assessment has greatly reduced the costs of holding agricultural real estate. The real estate taxes for agricultural land are much lower than they once were. While Interest rates are lower than they were in 2024, they are still higher than their all-time low in 2022. Expanding dairy businesses may need to rely on long-term leases or manure trading arrangements to ensure compliance with environmental regulations and land-use constraints.
Although dairy farming is well-suited to the climate, topography, and infrastructure of Wisconsin, the continued survival of a viable dairy industry depends upon access to affordable land resources.
Published: May 20, 2026
Reviewed by: Silva Gaku, Farm Financial Outreach Specialist, UW-Madison Division of Extension, and Stephanie Plaster, Farm Business Development Outreach Specialist, UW-Madison Division of Extension