Abstract
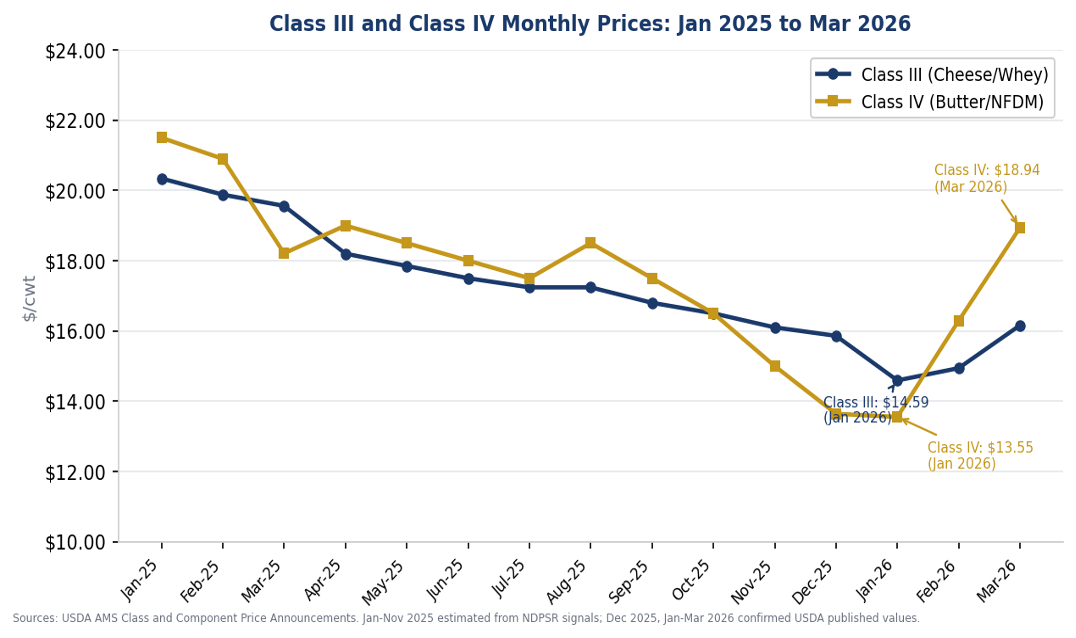
Through the first quarter of 2026, Class III and Class IV milk prices diverged substantially. By March, Class IV was running $2.78/cwt above Class III on the strength of a sharp nonfat dry milk (NFDM) rally. This article walks through the mechanical source of that divergence using the Federal Milk Marketing Order (FMMO) formulas, identifies the structural shift in skim milk disposition toward ultrafiltration and high protein products as the underlying driver of NFDM supply tightness, and explains why this Class IV strength does not translate directly into higher pay prices for Wisconsin producers whose milk routes to cheese plants. It works to partially explain why the numbers in industry publications do not always match what shows up on a Wisconsin milk check.
Current Class Prices
Class III milk opened 2026 at $14.59/cwt in January, its lowest monthly value since July 2023. Class IV touched $13.55/cwt that same month, also its weakest reading in several years. Both prices have since moved higher. March 2026 confirmed figures place Class III at $16.16/cwt and Class IV at $18.94/cwt. The year over year comparison, however, remains unfavorable for Class III. March 2026 came in $3.40 below March 2025 (U.S. Department of Agriculture, Agricultural Marketing Service [USDA AMS], 2026a).
Table 1. Class and component price announcements, first quarter 2026.
| Month | Class III ($/cwt) | Class IV ($/cwt) | Class III vs. year ago |
|---|---|---|---|
| Jan 2026 | $14.59 | $13.55 | Down $5.75 vs. Jan 2025 |
| Feb 2026 | $14.94 | $16.29 | Down $4.94 vs. Feb 2025 |
| Mar 2026 | $16.16 | $18.94 | Down $3.40 vs. Mar 2025 |
How Class Prices are Set
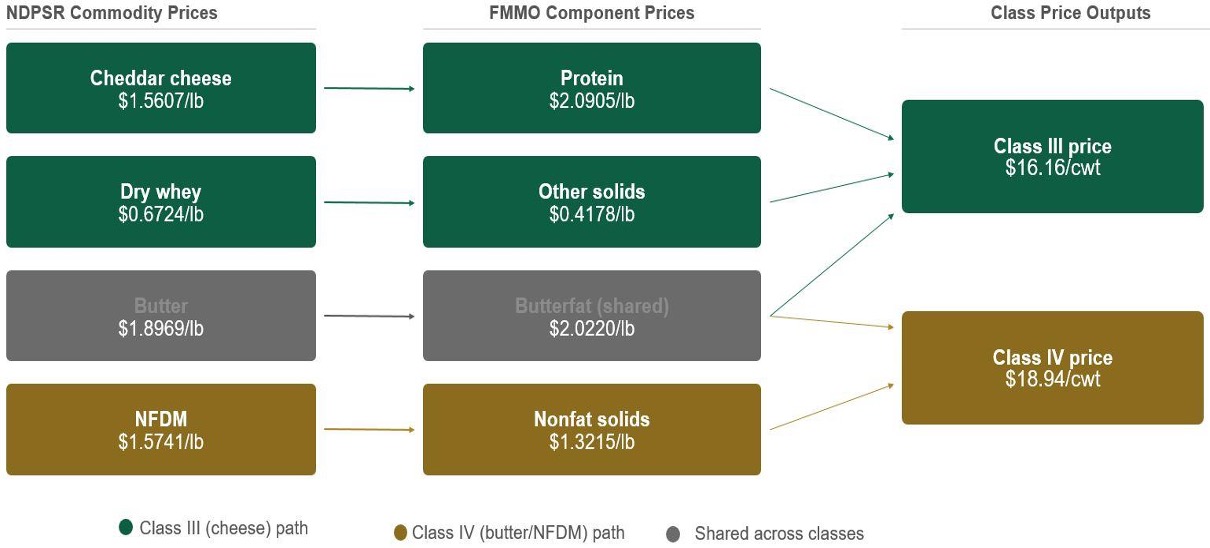
Class III and Class IV prices are FMMO formula outputs. Under 7 CFR 1000.53, USDA calculates each month’s Class III price from the National Dairy Products Sales Report (NDPSR) cheddar cheese and dry whey prices, while the Class IV price is derived from NDPSR butter and NFDM prices (Code of Federal Regulations, 2024). These commodity prices feed a set of component price formulas for protein, butterfat, other solids, and nonfat solids. Make allowances, which are standard manufacturing cost deductions, are embedded in each of those formulas. The resulting component prices are then applied to the composition of producer milk to determine its value under each class.
Figure 1 shows the flow from left to right. Cheese and dry whey prices feed the component formulas that set Class III. Butter and NFDM prices feed the formulas that set Class IV. Butterfat is the only component that is shared across both classes, which is worth noting because it means the entire Class III versus Class IV divergence is a skim milk story. Because the two class prices are derived from entirely different commodity benchmarks, they can move in substantially different directions when those benchmarks diverge, as they have in the first part of 2026.
Figure 1. How Class III and Class IV Prices are Set?
Why Class IV has moved so much more than Class III
The Class IV rally is being driven by NFDM, a powder produced by removing water from skim milk. NFDM sets the nonfat solids value in the FMMO formula, which in turn determines the Class IV skim milk price. That Class IV skim value was $12.29/cwt in March 2026, compared to a Class III skim milk price of $9.41/cwt. The $2.88/cwt gap reflects very different conditions on the cheese side versus the powder side of the complex (USDA AMS, 2026a).
Where NFDM Comes From
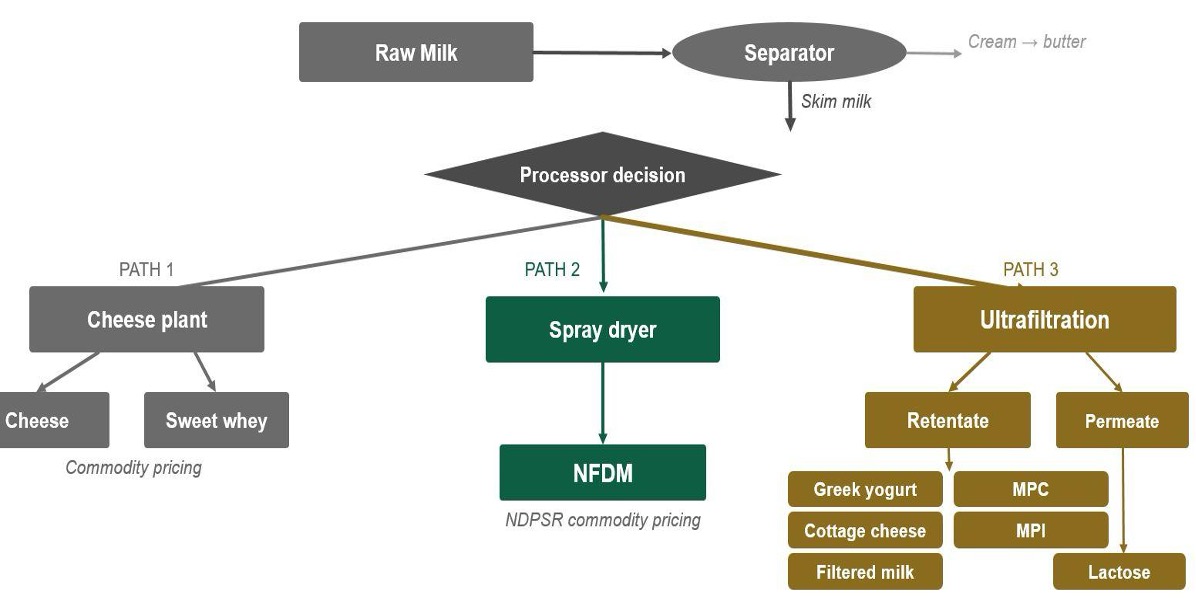
Before going further, it helps to be precise about where NFDM actually originates in the processing system. NFDM is produced from skim milk, not from whole milk and not from cheese directly. The skim stream itself can come from two different starting points. At a dedicated butter and powder plant, raw milk arrives and is run through a cream separator. The cream goes to the butter churn and sets the Class IV butterfat value. The skim goes to a spray dryer and becomes NFDM. At a cheese plant, raw milk is also standardized to hit a target fat ratio before it enters the cheese vat, and some plants pull off excess skim during that standardization step. That excess skim can be dried into NFDM if the plant has drying capacity, or it can be sold to a separate powder operation. Sweet whey from cheesemaking is a third stream entirely, and it feeds dry whey, whey protein concentrate (WPC), and whey protein isolate (WPI) markets rather than NFDM.
In practice, most U.S. NFDM production comes from dedicated butter and powder operations rather than from cheese plants. Spray dryers are capital-intensive equipment sized for volume, and dedicated plants run them continuously. Cheese plants generally do not operate their own NFDM dryers, though some large integrated operations do both. The practical implication is that when the industry discusses NFDM supply, the relevant question is what is happening at butter and powder plants and at the few integrated operations that run spray dryers alongside cheese vats. Figure 2 shows the skim milk processing decision and why recent shifts in that decision are reducing NFDM output.
Figure 2. Where Does the Skim Milk Go?
The NFDM price moved from $1.175/lb at the start of January to a CME spot peak of $1.87/lb in mid-March, the highest observation since June 2022. The USDA NDPSR weekly average for the week ending March 21 confirmed a price of $1.59/lb, as summarized in Table 2 (USDA AMS, 2026b; CME Group, 2026). The cause is not stronger demand for the powder itself. Growing consumer interest in high protein dairy products, including filtered milk beverages, Greek yogurt, and cottage cheese, has pulled an increasing share of skim milk into ultrafiltration processing, where the protein fraction is concentrated and sold into ingredient markets at considerably higher values than the nonfat solids price would pay. Less skim milk is reaching NFDM dryers than manufacturers had anticipated, and the resulting supply tightness, not a demand surge, is what moved the price. This shift is structural rather than cyclical. Multiple processors have announced ultrafiltration capacity expansions, and production data from the USDA Economic Research Service show annual NFDM output declining from roughly 2,047 million pounds in 2021 to 1,655 million pounds in 2025, even as total U.S. milk production grew over the same period (U.S. Department of Agriculture, Economic Research Service [USDA ERS], 2025).
Table 2. Dairy price and powder market indicators, first quarter 2026
| Category | Statistic | Value |
|---|---|---|
| Milk class prices | Class IV skim milk price, March 2026 | $12.29/cwt |
| Class III skim milk price, March 2026 | $9.41/cwt | |
| Class IV minus Class III skim price gap | $2.88/cwt | |
| NFDM market | NFDM price at start of January 2026 | $1.175/lb |
| CME spot NFDM peak in mid March 2026 | $1.87/lb | |
| USDA NDPSR weekly average, week ending March 21, 2026 | $1.59/lb | |
| Absolute increase from January start to March peak | $0.695/lb | |
| Percent increase from January start to March peak | 59.1% |
For Wisconsin cheese route producers, this NFDM driven Class IV strength does not flow directly into the pay price. Pooled milk Class III value is set by cheddar cheese and dry whey prices through the NDPSR. The protein component at $2.0905/lb in March contributes meaningfully to skim milk value. The other solids component, set by dry whey at $0.4178/lb, has softened as processing capacity has shifted toward higher value whey protein concentrates and isolates. That softness is a partial offset to the protein value in Class III pay (USDA AMS, 2026a).
Supply and What Futures Markets Currently Reflect
U.S. milk production remains the primary restraint on Class III prices. January 2026 production came in at 19.81 billion pounds, up 3.2 percent from a year earlier (U.S. Department of Agriculture, National Agricultural Statistics Service [USDA NASS], 2026). Export performance has provided meaningful offset. Cheese exports in January 2026 ran 24 percent ahead of the prior year (USDA ERS, 2026). USDA’s March 2026 Dairy Outlook placed full year 2026 Class III at $16.65/cwt and Class IV at $17.15/cwt. These are USDA’s central estimates given current information and conditions. They are not guaranteed outcomes. Futures markets reflect what participants are currently willing to pay and accept, incorporating available information about supply, demand, and risk at the time of trading. If conditions change materially, prices adjust accordingly.
What to Watch From Here
Three numbers matter most for Wisconsin cheese route producers as this market moves through 2026: the cheddar cheese price, the dry whey price, and how the Class III skim milk price responds as those two commodity inputs evolve through the NDPSR each week. The NFDM story is real and worth understanding, but it is a Class IV story. The headlines about powder prices do not change the check unless the milk is going to a butter and powder plant.
What does affect the Class III pay price is a cheese market that remains below its year ago levels despite the broader market noise about dairy price strength, and a dry whey component that has softened as processors move whey toward higher value protein products. Those two pressures are the actual headwinds in Wisconsin cheese route pay prices right now.
The structural shift in how skim milk is used, with more going toward ultrafiltration and high protein products and less toward commodity powder, is not going away. It is reshaping the economics of different processor routes in ways that will matter for years. Understanding which side of that shift a producer’s milk sits on, and why the Class III and Class IV prices can diverge as sharply as they have, is the kind of market literacy that serves producers in any price environment.
Producers with questions about how these prices translate to a specific milk check can contact the UW Madison Division of Extension or their cooperative field representative.
Published: May 13, 2026
Reviewed by: Matthew Lippert, Regional Dairy Educator, UW-Madison Division of Extension, and Katelyn Goldsmith, Dairy Outreach Specialist, UW-Madison Division of Extension
References
- CME Group. (2026). Dairy futures and spot market data. https://www.cmegroup.com/markets/agriculture/dairy/
- Code of Federal Regulations. (2024). Prices [7 CFR 1000.53]. U.S. Government Publishing Office. https://www.ecfr.gov/current/title-7/part-1000/section-1000.53
- U.S. Department of Agriculture, Agricultural Marketing Service. (2026a). Announcement of class and component prices for March 2026. https://www.ams.usda.gov/mnreports/dymclassprices.pdf
- U.S. Department of Agriculture, Agricultural Marketing Service. (2026b). National Dairy Products Sales Report [weekly]. https://www.ams.usda.gov/mnreports/dywdairyproductssales.pdf
- U.S. Department of Agriculture, Agricultural Marketing Service. (2026c). Uniform dairy market report [monthly]. https://mymarketnews.ams.usda.gov/
- U.S. Department of Agriculture, Economic Research Service. (2025). Dairy data: Supply and utilization of dairy products. https://www.ers.usda.gov/data-products/dairy-data/
- U.S. Department of Agriculture, Economic Research Service. (2026). Livestock, dairy, and poultry outlook: March 2026 (LDP-M-383). https://www.ers.usda.gov/publications/pub-details/?pubid=113844
- U.S. Department of Agriculture, National Agricultural Statistics Service. (2026). Milk production: February 2026. https://usda.library.cornell.edu/concern/publications/h989r321c