Skip to content
UW Madison Crest

Farm Management

Division of Extension

  • Topics
    • Ag Land Pricing & Contracts
    • Agriculture Automation
    • Business Development, Transition & Succession
    • Financial Management
    • Human Resources
    • Policy, Markets & Marketing
    • Safety & Health
    • Small-Scale Fruit & Vegetable Farmers/Growers
  • Upcoming Events
  • News
  • Programs
    • Becoming the Employer of Choice
    • Certified Farm Succession Coordinator Training
    • Cultivating Your Farm’s Future
    • Farm Pulse: Crop Insurance and Grain Marketing
    • Farm Pulse: Financial Management
    • Getting started with your food or farm business
    • Navigating Your Ag Business: From Stress to Success
    • Shoebox to Strategy: Organizing Your Farm Legacy
  • Articles
  • Our People
  • About
    • Impacts
  • Contact Us
Search
University of Wisconsin-Extension
Articles > Dairy Markets & Policy

June 2024 Dairy Market Update: US dairy industry still waiting on demand…

Written by Leonard Polzin
Share
  • Share:
  • Share on Facebook
  • Share on X (Twitter)
  • Share via Email
  • Copy Link

Copied!

Increased efficiency at the farm level has muted the milk supply response as traditionally measured by cow numbers. We have seen milk supplies slowly tighten through the first half of 2024 and might be seeing signs of tightening supplies at the processor level. If so, this could help maintain mailbox prices at or above breakeven for the rest of the summer. One of the larger questions yet to be answered is whether both domestic and international demand will continue to hang on enough to continue clearing markets and prevent inventory buildup across the dairy complex.

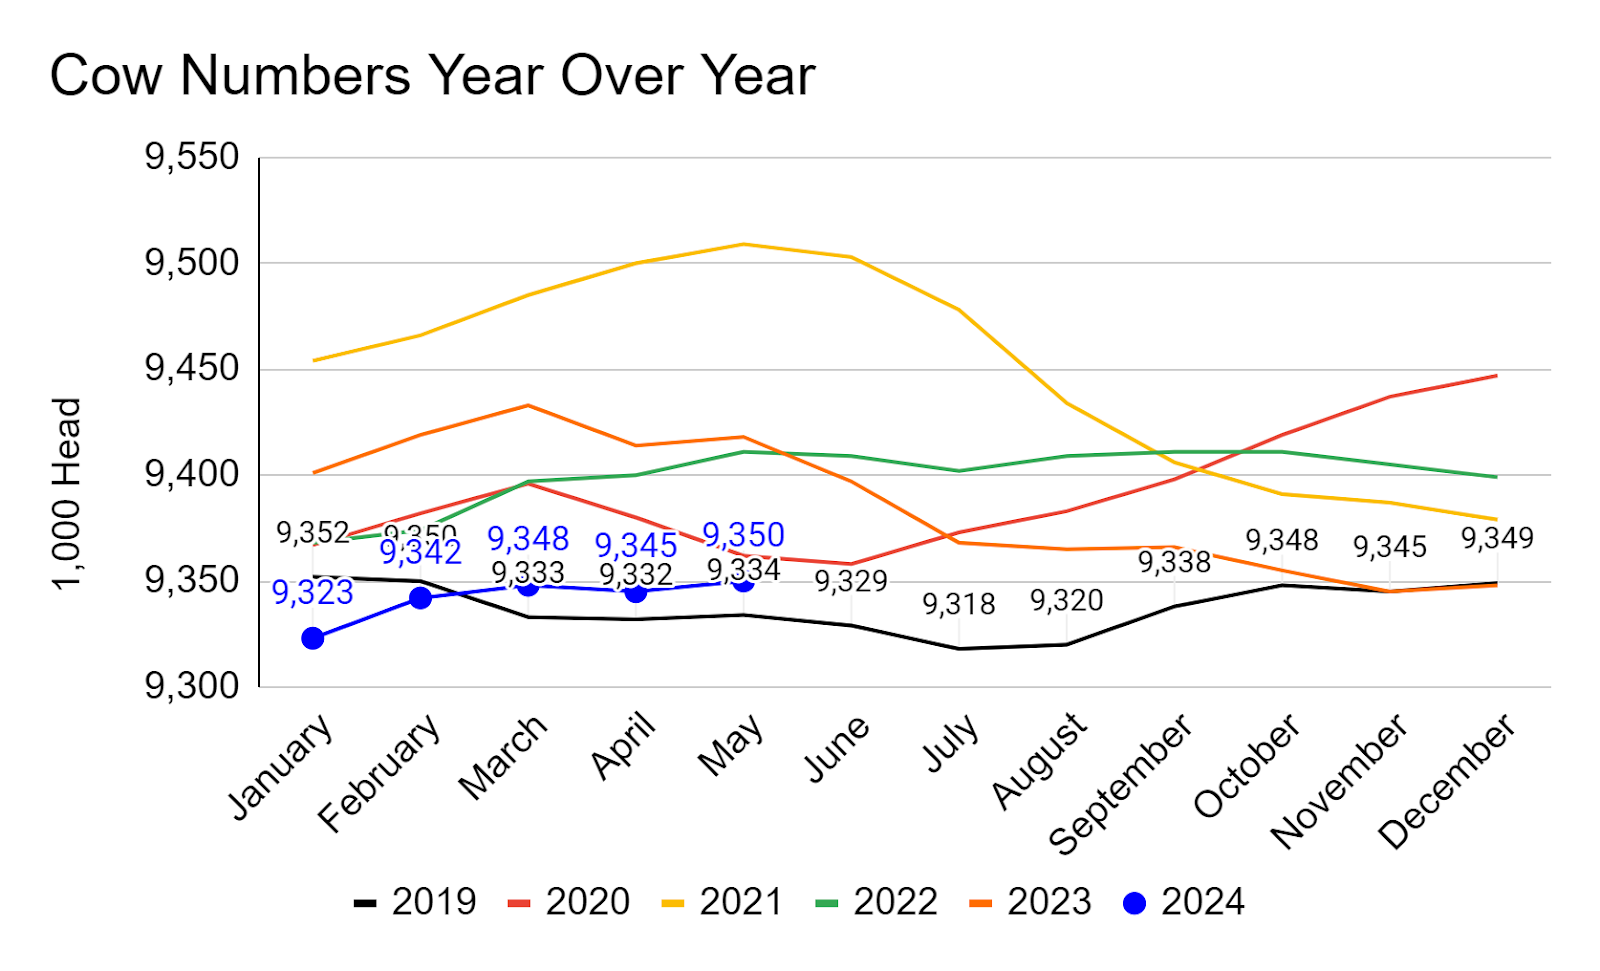
The United States Department of Agriculture National Agricultural Statistics Service (NASS) report updated cow numbers to 9.350 million for May 2024 (Figure 1). Despite a month-over-month increase of approximately 5,000 head from April 2024, the year-over-year change in cow numbers shows a decrease of 68,000 head for May 2024 compared to May 2023.

Line graph depicting cow numbers, year over year
Figure 1

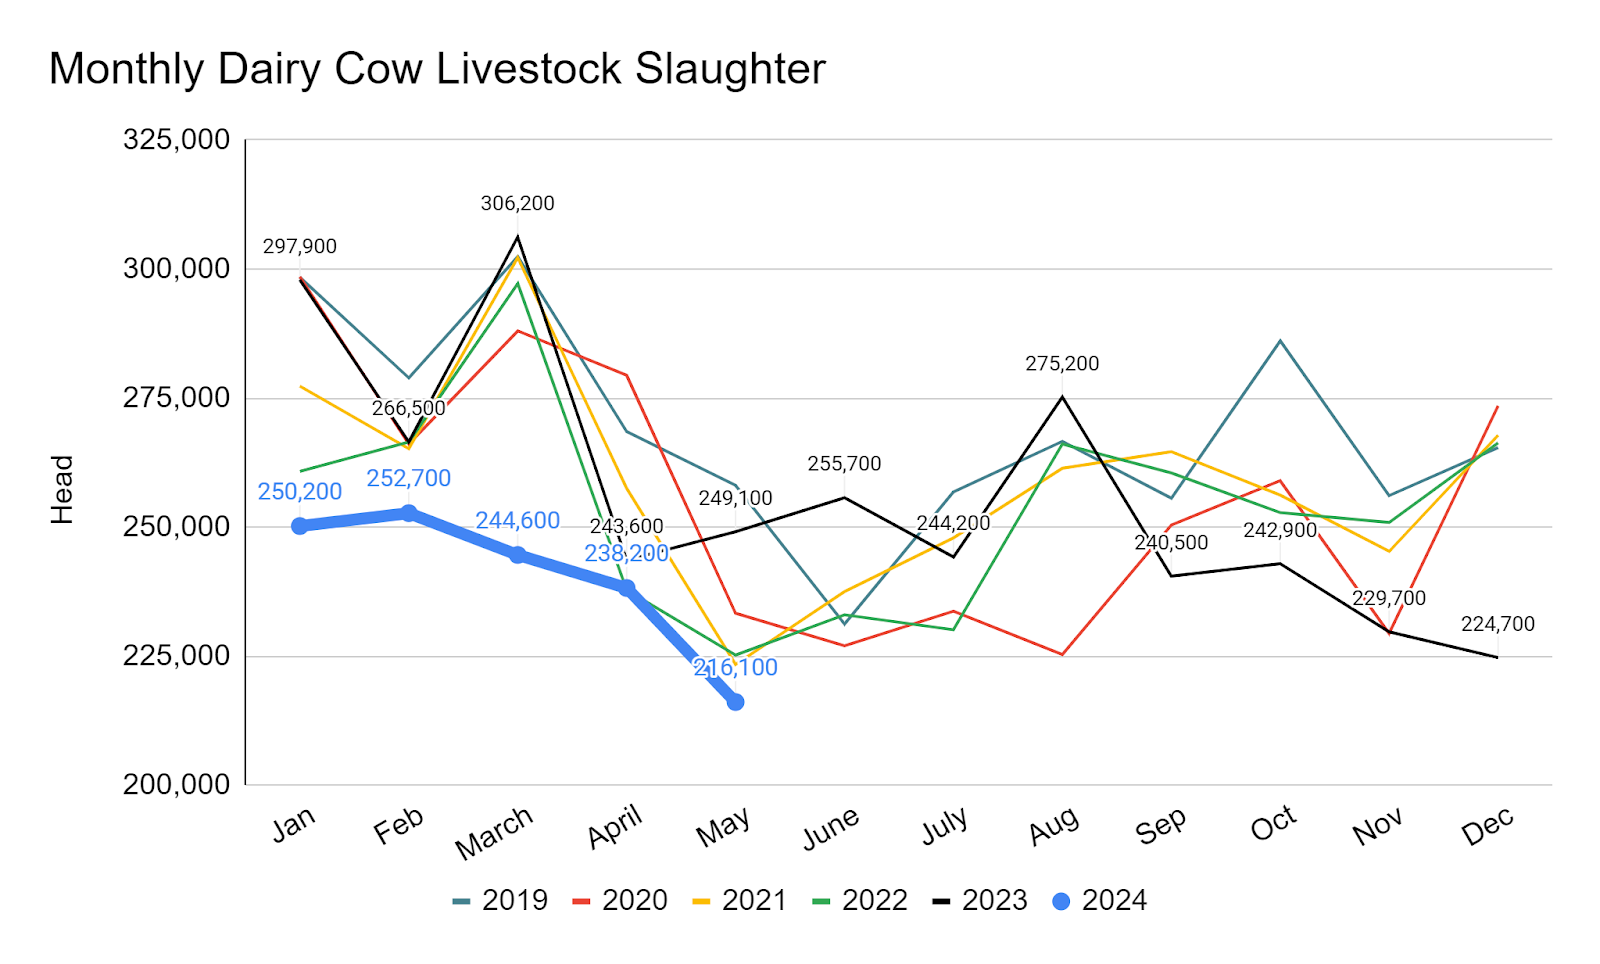
The Livestock Slaughter report by NASS shows that the number of dairy cows slaughtered in May 2024 was 216,100 head (Figure 2). This represents a decline of 33,000 head compared to the 249,100 head slaughtered during the same period in 2023. This is not surprising as producers continue to optimize animal inventory across all ages of animals on the farm and hold on to cows longer. 

Line graph depicting monthly dairy cow livestock slaughter, year over year
Figure 2

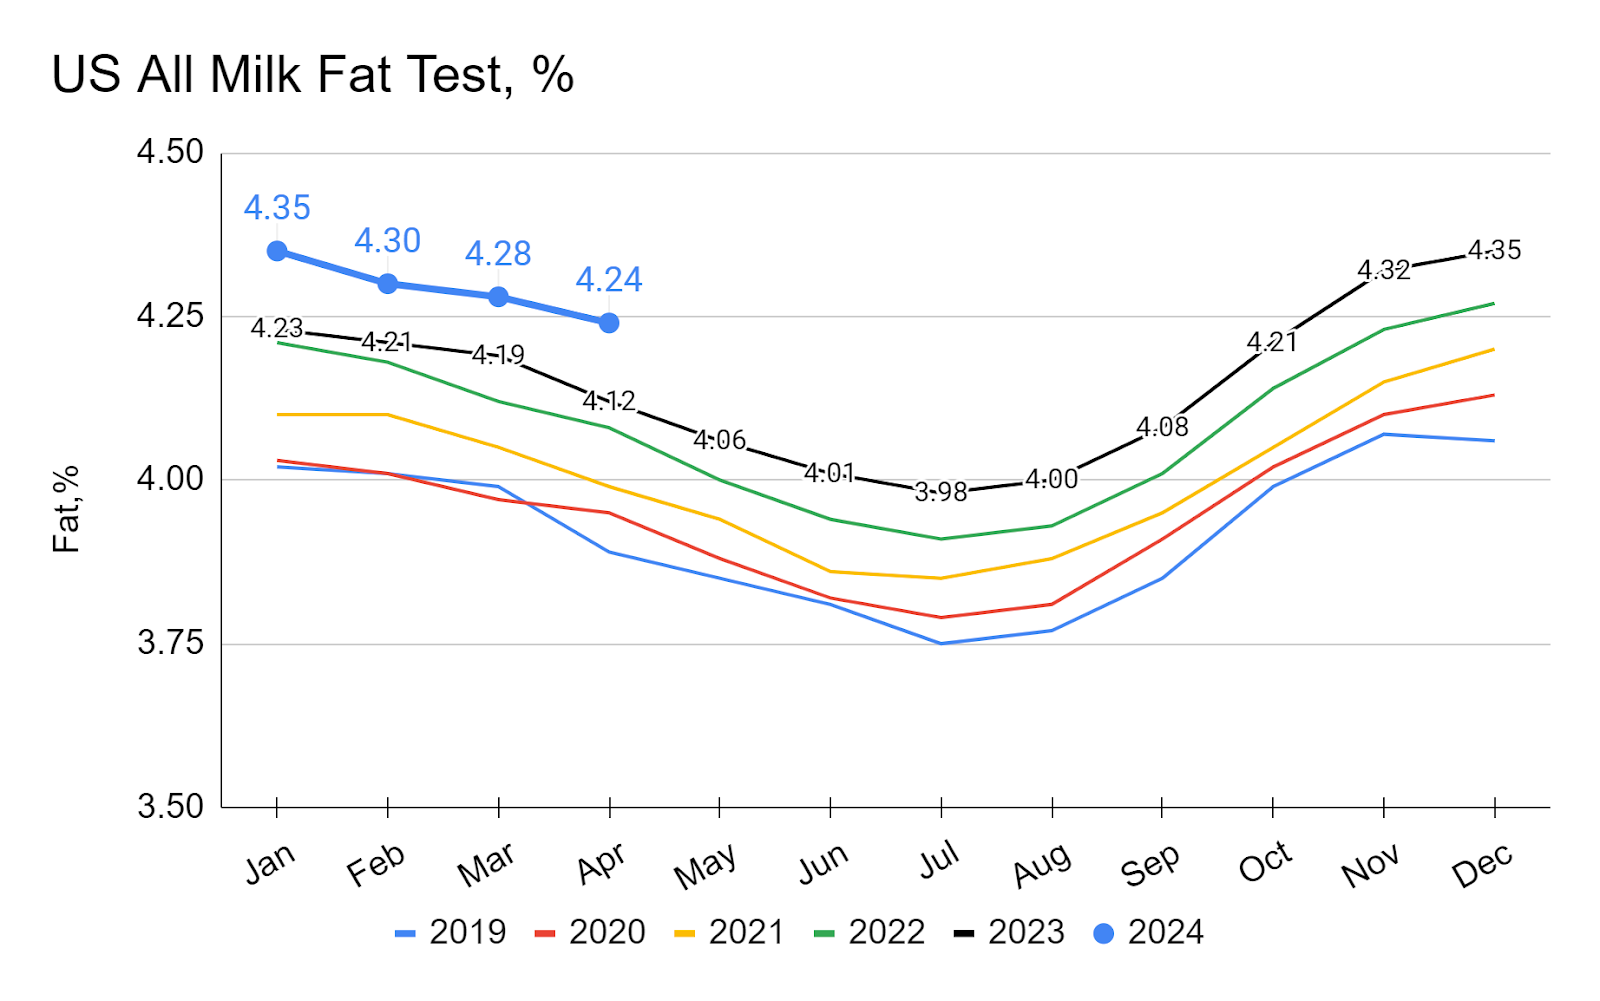
The monthly average fat test, according to USDA NASS data, rose from 4.12% in April 2023 to 4.24% in April 2024 (Figure 3). Despite a month-over-month decline of 0.04%, there is an increase of 0.12% compared to the previous year.

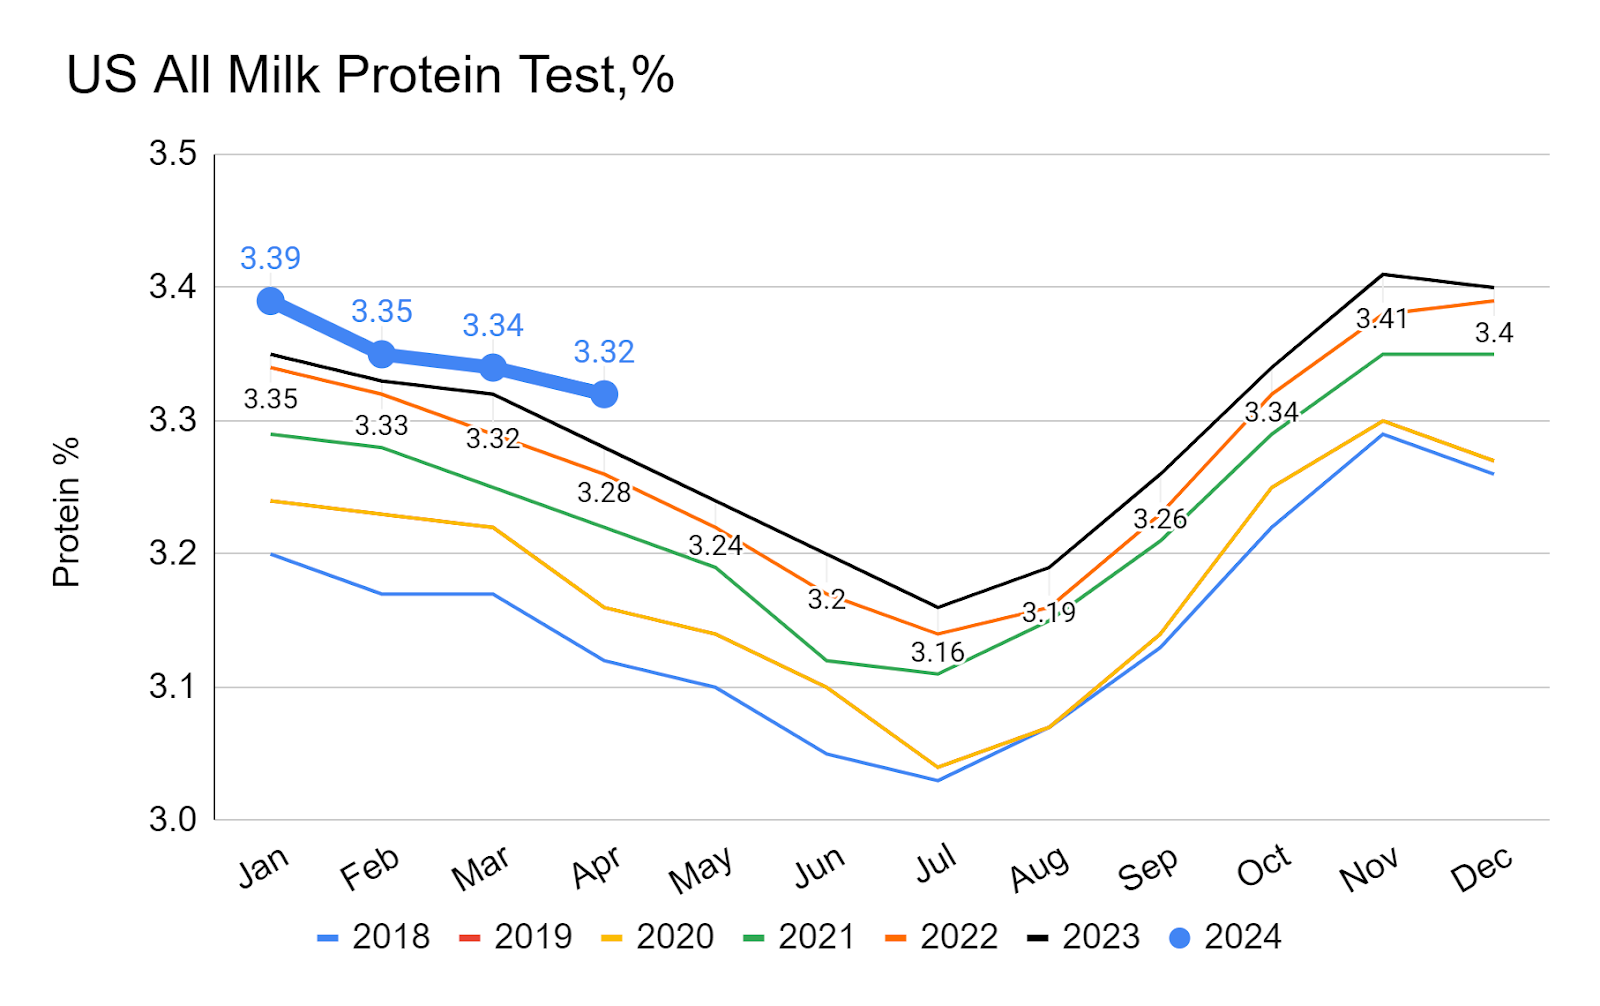
Similarly, milk protein test values have been on a year-over-year rise, averaging 3.26% in 2022, 3.28% in 2023, and 3.32% in April 2024 (Figure 4). There is an increase of approximately 0.04% as of April 2024 compared to the same period in the previous year.

Our national dairy herd has continued to increase components when measured monthly on a year-over-year basis, almost without exception. This increase in solids production has muted some of the supply responses typically seen with decreased cow numbers. There are no signs that this increase in solids will stop or slow down. 2024 appears poised to continue setting new monthly records for all 12 months. 

Line graph depicting US All Milk Fat Test, %
Figure 3
Line graph depicting US All Milk Protein Test, %
Figure 4

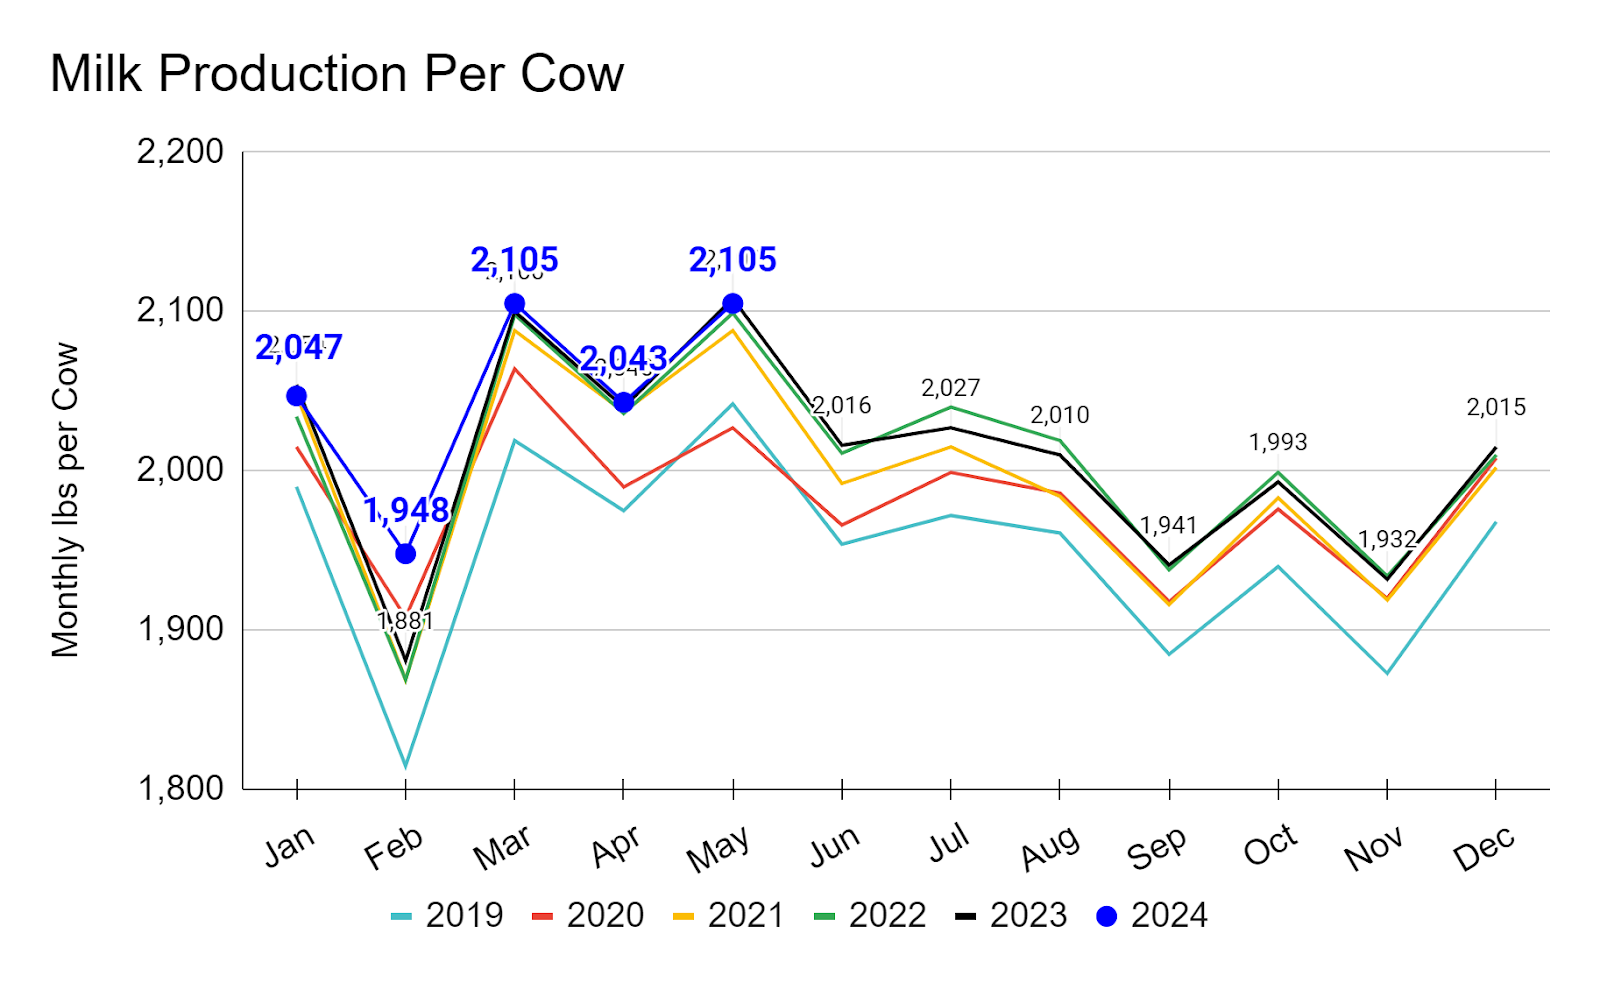
The US dairy herd had an average monthly milk production per cow of 2,105 lbs in May 2024 (Figure 5). Despite a month-over-month increase of 62 lbs, there was a decrease of 3 lbs in milk production per cow in May 2024 compared to the same period in the previous year. This represents a year-over-year decrease of 0.14% in average milk production per cow in the US dairy market for May 2024. Even with this slight year-over-year decrease, we are still well within our historical range of production per cow.

A line graph depicting milk production per cow, year over year
Figure 5

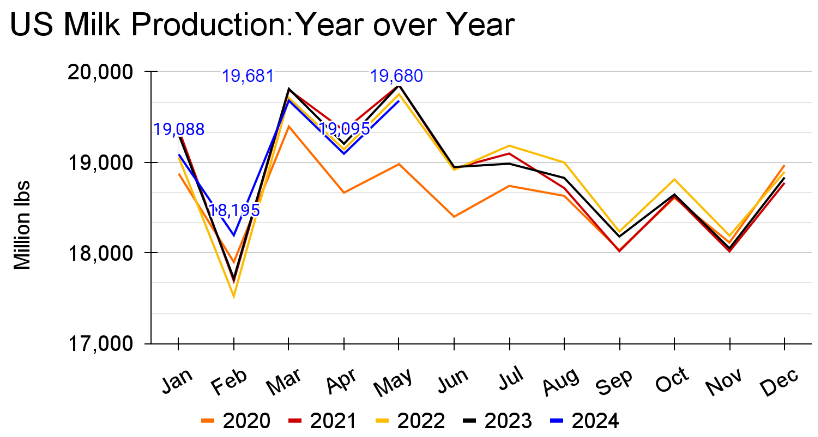
The year-over-year U.S. total monthly milk production is 19.68 million lbs as of May 2024 (Figure 3). This represents a decrease of 172 million lbs compared to the same period in 2023, indicating approximately a 0.87% decline in May 2024. When taking into account the changes in cow numbers, solids production, and total U.S. monthly milk production, we quickly see a story of increased efficiency at the farm level. While producers have responded to market price pressures by decreasing supply via the number of cows, total milk production has not fallen at the same rate. When accounting for the continual increase in solids production, the change in cow numbers is even more muted. Producers have been gradually reducing supply through cow numbers since the second half of 2023, raising the question of whether we have seen enough market supply response to signal that milk supply is finally tightening. Anecdotal evidence from the last month or two suggests that tighter supplies of milk in Class III would indicate yes. If so, that might provide enough price support to hold up the bottom of Class III prices.

With the return of margin to some producers and potentially a base level of price support, this leads to the longer-term question of when the dairy industry is likely to see growth. Looking towards the end of 2024 and the first quarter of 2025, it seems reasonable to expect some growth in milk production. If that occurs, the hope is that demand, both domestic and international, will be able to keep up.

Line graph depicting US Milk Production: Year over Year

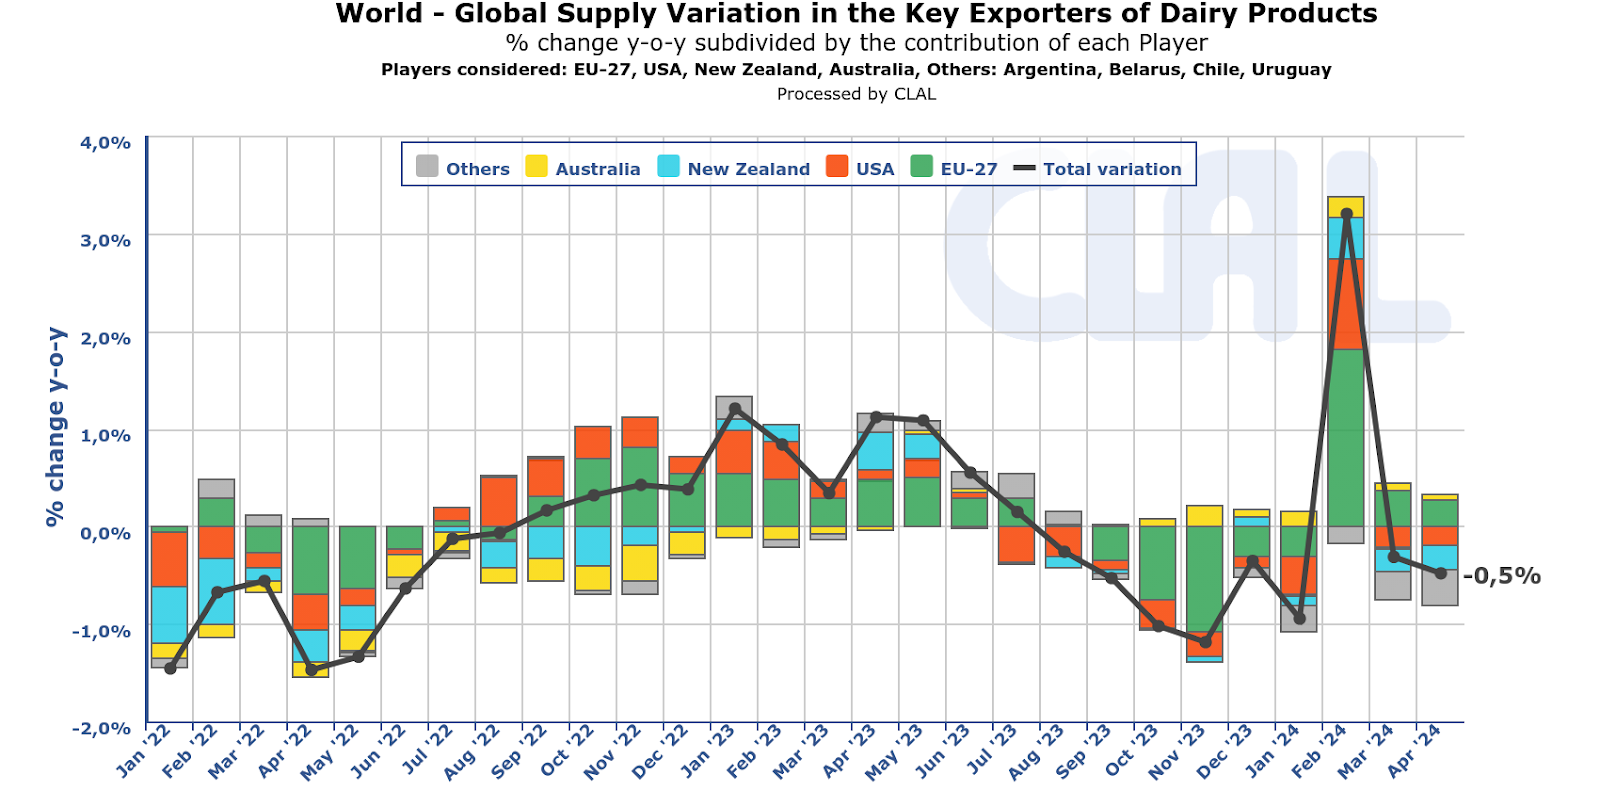
When looking at the data for “Global Supply Variation in the Key Exporters of Dairy Products” by CLAL for January 2024, the USA’s variation is negative. The year-over-year reduction in dairy supply from the United States is approximately 0.5% as of April 2024 (Figure 7).  

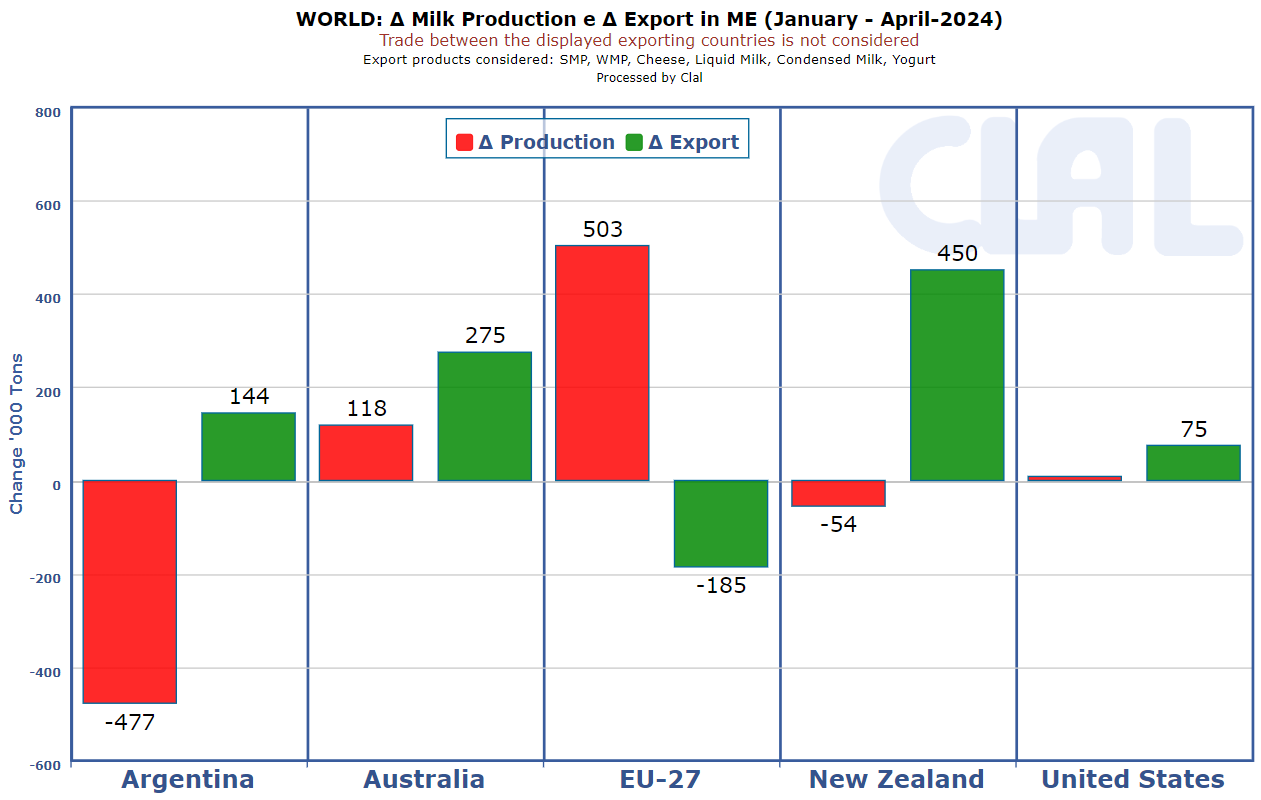
Currently, the US dairy market is facing a competitive export environment. US export statistics for January-April,2024 show a change of approximately 75,000 tons, which includes the exports of cheese, fluid milk, condensed milk, yogurt, SMP, and WMP. To support higher farm-level prices, there needs to be continued exports in the upcoming months of 2024 (Figure 8).

Bar chart depicting global supply variation in the key exporters of dairy products
Figure 7
Bar chart depicting the change in milk production vs change in export
Figure 8
Print This Page

Author: Leonard Polzin

Photo of Leonard Polzin

More from Leonard

Latest News

  • USDA Offers Disaster Assistance to Agricultural Producers in Wisconsin Impacted by Winter Storms
  • Extension Farm Management in the News: March 2026
  • Farmers and Agricultural Professionals Invited to Pilot Bilingual Farm Safety Toolbox
  • Extension announces AgrAbility and Youth Tractor Safety Outreach Program Coordinator

Farm Management Newsletter

To stay up to date on the latest information and upcoming programs from Farm Management, sign up for our newsletter.

Sign Up Now

You May Also Like

  • Raw Milk in the U.S. (Cow’s Milk): Regulation, Public Health Risk, Market Spillovers, and Policy ImplicationsRaw Milk in the U.S. (Cow’s Milk): Regulation, Public Health Risk, Market Spillovers, and Policy Implications
  • Dairy Margin Coverage in 2026: What Changed, What Recent Margin History Shows (2019–2025), and Why Payment Duration MattersDairy Margin Coverage in 2026: What Changed, What Recent Margin History Shows (2019–2025), and Why Payment Duration Matters
  • Dairy Margin Coverage: Information for Dairy OwnersDairy Margin Coverage: Information for Dairy Owners
  • Milk, Cookies, and Christmas Eve: Santa’s Dairy Tab by the NumbersMilk, Cookies, and Christmas Eve: Santa’s Dairy Tab by the Numbers

Division of Extension

Connecting people with the University of Wisconsin

  • Agriculture
  • Community Development
  • Health & Well-Being
  • Families & Finances
  • Natural Resources
  • Positive Youth Development

Agriculture at Extension

  • Agriculture Water Quality
  • Crops and Soils
  • Dairy
  • Horticulture
  • Livestock
  • Discovery Farms
  • Master Gardener

Other UW-Madison Resources

  • Department of Animal and Dairy Science
  • Department of Ag and Applied Econ
  • Renk Business Institute

Questions?

Contact us at farms@extension.wisc.edu

Farm Management Newsletter

To stay up to date on the latest information and upcoming programs from Farm Management, sign up for our newsletter.

Sign Up Now

Home page photo courtesy of the University of Wisconsin Madison, College of Agricultural & Life Sciences

University of Wisconsin-Madison      |        Explore Extension: Agriculture Community Development Families & Finances Health Natural Resources Youth
Connect With Us
Support Extension
Extension Home

We teach, learn, lead and serve, connecting people with the University of Wisconsin, and engaging with them in transforming lives and communities.

Explore Extension »

County Offices

Connect with your County Extension Office »

Map of Wisconsin counties
Staff Directory

Find an Extension employee in our staff directory »

staff directory
Social Media

Get the latest news and updates on Extension's work around the state

facebook iconFacebook

twitter icon Follow on X


Facebook
Follow on X

Feedback, questions or accessibility issues: info@extension.wisc.edu | © 2026 The Board of Regents of the University of Wisconsin System
Privacy Policy | Non-Discrimination Statement & How to File a Complaint | Disability Accommodation Requests

The University of Wisconsin–Madison Division of Extension provides equal opportunities in employment and programming in compliance with state and federal law.