
Introduction
Two dairy products are having a moment, and for much the same reason: American consumers want more protein, and they increasingly want it from whole, recognizable foods. One of these products, high-protein whey, is in genuine shortage, with ingredient prices at levels the industry has not seen before. The other, cottage cheese, has gone from a fading mid-century diet food to one of the fastest-growing categories in the dairy case.
What makes these stories worth understanding is not just that demand is up. The explosive growth of these two dairy categories reveals the difficulty of adapting complex business and production structures to rapid change.
Part 1: High-protein whey, value in the last one percent
Start with the plumbing
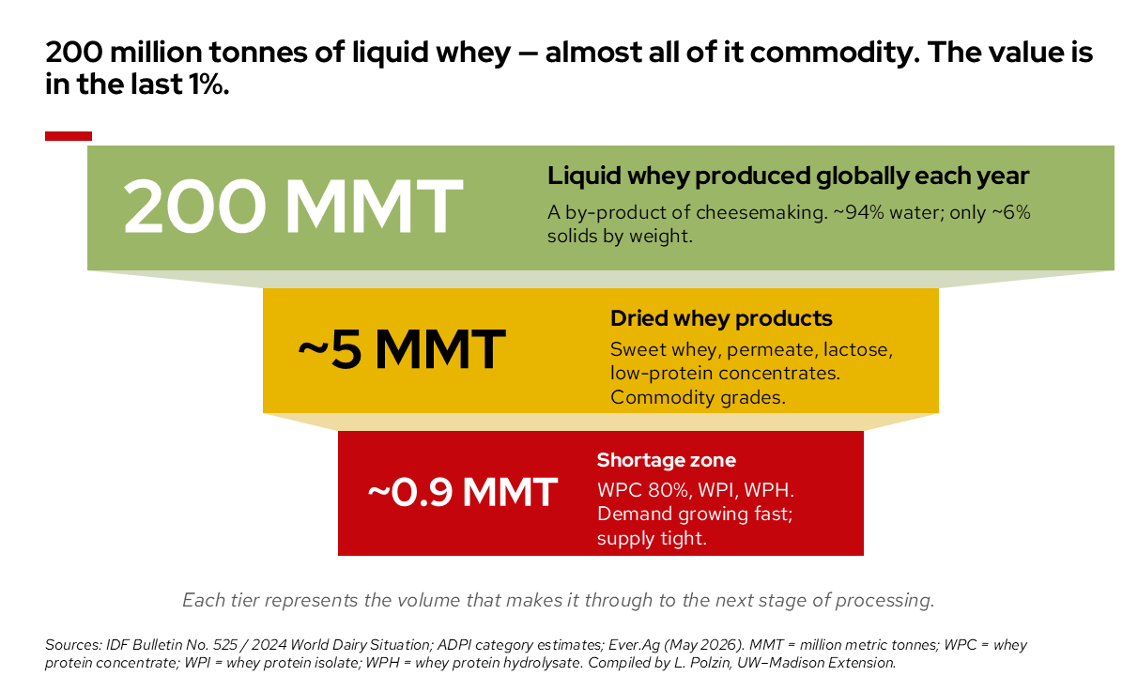
Whey is what is left when you make cheese. Milk is split into curds, the casein and fat that become cheese, and a watery liquid called whey. Whey is a byproduct of cheese manufacturing. Globally, cheesemaking generates roughly 200 million metric tonnes of liquid whey every year. The catch is that liquid whey is about 94 percent water and only around 6 percent solids. On its own it is nearly worthless, and for most of dairy history it was a disposal problem, fed to pigs, spread on fields, or sent down the drain.
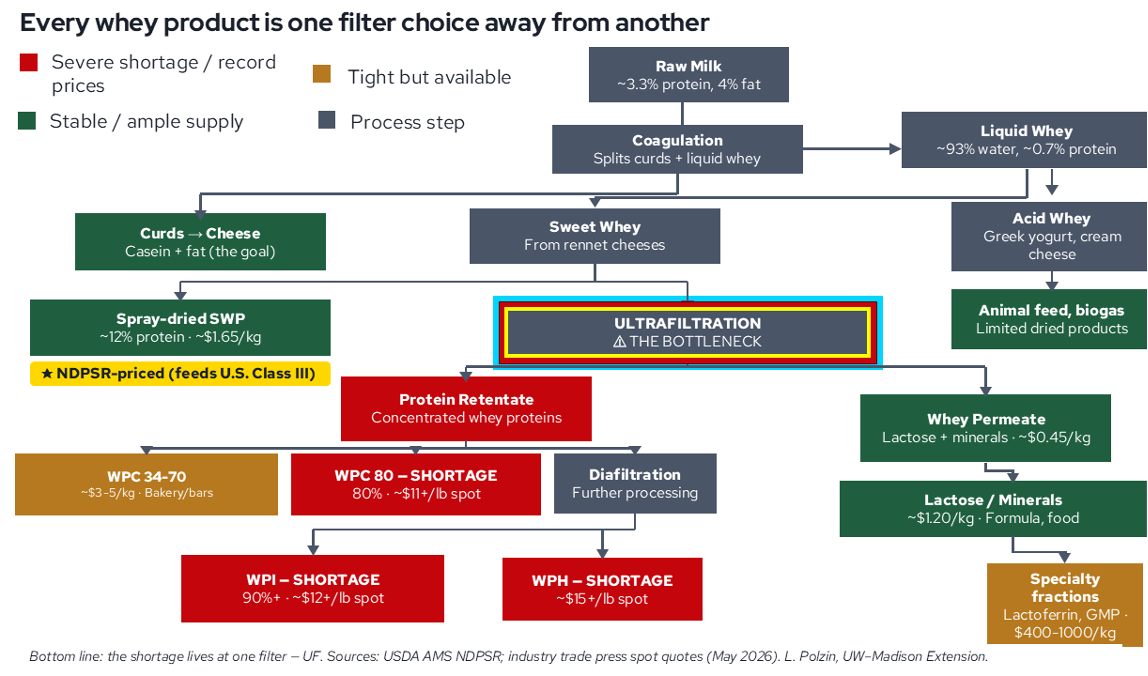
The modern whey industry exists because processors learned to dry that liquid and, later, to filter it into progressively more concentrated and more valuable forms. This is the single most important thing to understand about the whole market: whey products are defined by how much you filter them. Every whey product is one filtration choice away from another.
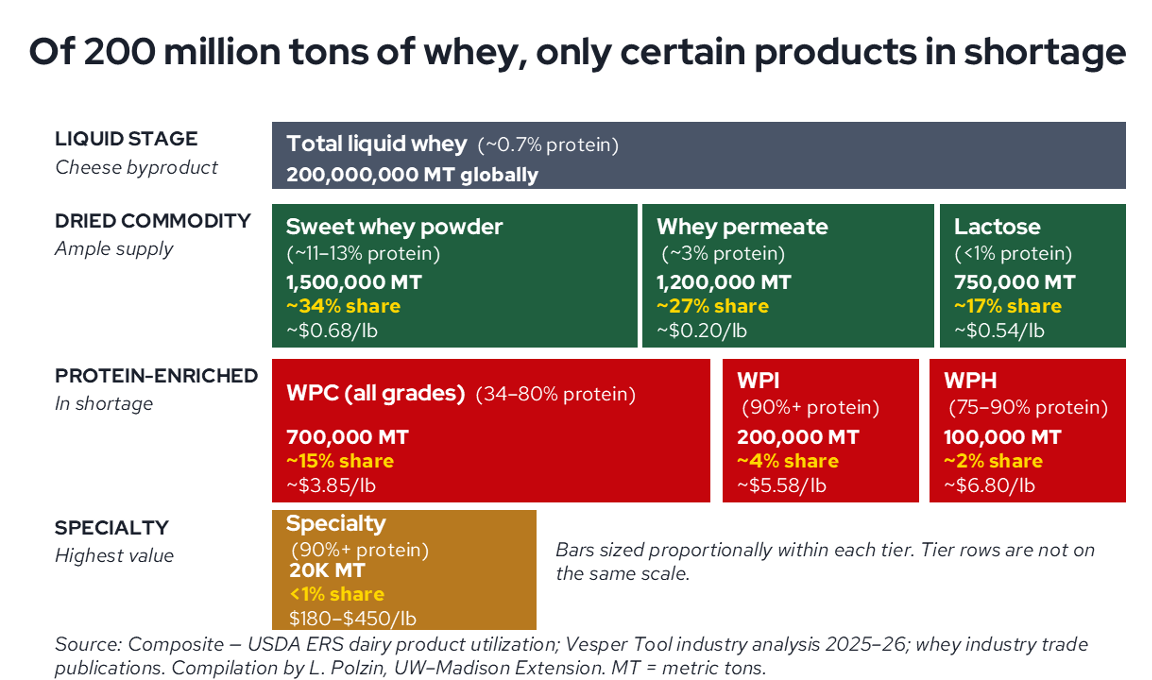
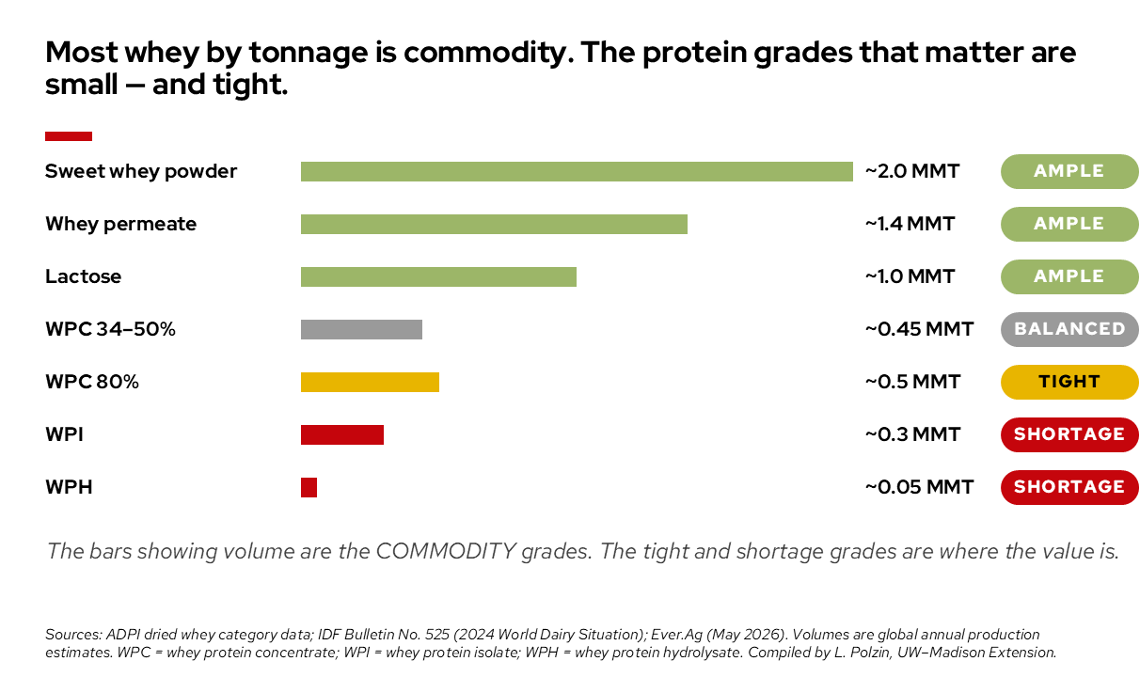
Run liquid whey through basic drying and you get commodity-grade products: sweet whey powder (around 11 to 13 percent protein), whey permeate (mostly lactose), and lactose itself. These are made in large volume, supply is ample, and they trade cheaply. Sweet whey powder runs well under a dollar a pound. Push the same stream through more aggressive membrane filtration, ultrafiltration and then diafiltration, and you concentrate the protein while stripping out lactose and minerals. That is how you get whey protein concentrate (WPC, ranging from 34 up to 80 percent protein), whey protein isolate (WPI, 90 percent or more), and whey protein hydrolysate (WPH). These are the grades that go into protein powders, ready-to-drink shakes, nutrition bars, and the protein-fortified versions of ordinary foods now crowding grocery shelves.
Here is the heart of it: of those 200 million tonnes of liquid whey, only a sliver, on the order of one percent, ends up as the high-protein grades. And that sliver is where almost all the value and almost all the current tension live. The commodity tiers are large and ample. The protein-enriched tiers are small and tight. WPI represents a tiny share of total whey solids but commands prices many times higher than commodity powder.
The bottleneck is a machine, not a cow
The most common misconception about the current whey shortage is that it reflects a milk shortage. It does not. A common misconception is that rising whey prices are caused by a shortage of milk; in reality, global dairy production has remained sufficient, and the constraint sits downstream in the processing chain. The U.S. raw milk supply has been steady. Cheese is being made, and liquid whey keeps flowing.
The constraint sits at one specific step: the ultrafiltration and spray-drying equipment that turns ordinary whey into high-protein whey. These processes require specialized membrane filtration systems and spray-drying towers that can take years and hundreds of millions of dollars to build, and most of the world’s major processing facilities are already running at or near full capacity. History shows cheese capacity and cow numbers expanding faster than the installation and commissioning of the membrane systems and drying towers that make them isolated. When demand for high-protein whey jumps, the commodity tiers stay well supplied while the protein tiers tighten. The shortage lives at one filter.
What demand is doing
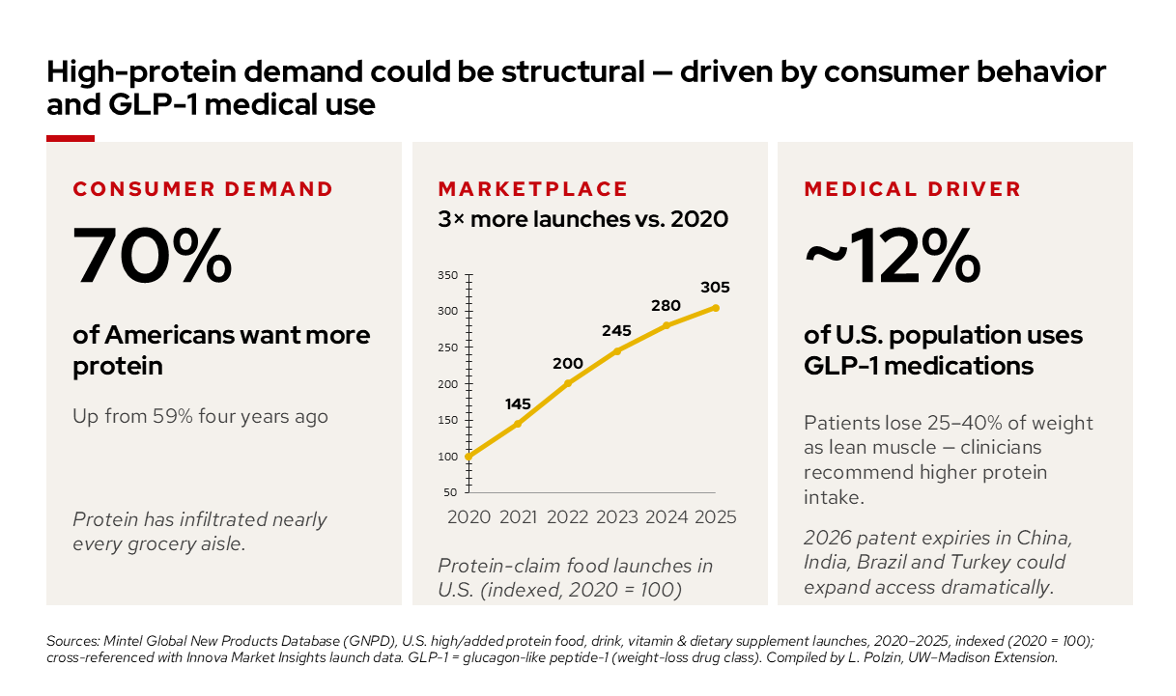
Demand has not just grown, it has changed character. The heightened demand for protein products, especially those made with whey, has put an unusual strain on the U.S. whey ingredient supply; even though raw milk has remained fairly stable, downstream processing capacity for WPC and WPI is reportedly running at its limit, creating a bottleneck. A broad consumer shift toward protein-forward eating is part of it. A newer driver is medical: a meaningful share of the U.S. population now uses GLP-1 weight-loss medications, and because whey protein is commonly recommended alongside these treatments to help preserve lean muscle, domestic consumption has reached record levels. The figures referenced in the graphics included with this piece put GLP-1 use at roughly 12 percent of the U.S. population, with patent expirations expected in several countries in 2026 that could expand access, and demand, further.
This medical dimension is worth separating from the broader trend. A food fad rests on taste and social momentum and can fade as quickly as it appears. GLP-1-linked demand is different: it is tied to a clinical regimen and a medical reason to keep protein intake high, which may give this part of the demand a steadier and longer-lasting basis than a typical swing in consumer preference.
Consumer-packaged-goods companies have taken note. Seeing sustained interest in protein, many have adjusted their product mix, reformulating existing items and extending lines to add protein-forward options, which in turn pulls more demand through to the high-protein whey grades that supply those formulations.
The price response has been pronounced. WPI prices have reached around $11 per pound, levels not previously seen in the market, and spot prices for 80-percent whey protein concentrate have topped $11 as well, with isolate sitting above that. Over a two-year window, industry sources estimate WPC costs up on the order of 108% and WPI costs up roughly 139%. The commodity grades did not follow the protein grades upward. Sweet whey powder production continued at steady rates and U.S. prices eased, while permeate stayed readily available. USDA National Dairy Products Sales Report (NDPSR) data show dry whey at about $0.64 per pound for the week ending May 23, 2026, up from roughly $0.52 a year earlier: higher year over year, but still a fraction of the protein-grade prices. A split market like that, with one tier at record highs and the adjacent tier far lower, points to filtration capacity rather than raw material as the binding constraint.
Why this market does not clear like others
High-protein whey did not develop as an open, buy-it-when-you-need-it commodity. It grew up largely as a relationship business built on negotiated, forward contracts between processors and large buyers such as supplement, sports-nutrition, infant-formula, and clinical-nutrition companies. There were practical reasons for this. The high-protein grades were a small, specialized output; buyers needed consistent specifications and guaranteed volume, and processors needed committed offtake to justify the capital cost of the filtration lines. Both sides valued the certainty of a contract, and a relatively thin spot market sat on top for marginal volumes. This is an example of path dependency: arrangements that made sense when the category was small continue to shape how the market behaves now that demand has grown.
This is the piece that has the current shortfall persisting, and it is where history matters. When demand surges, buyers that already hold forward contracts have much of their supply accounted for, while buyers without contracts depend more heavily on the thinner spot market. Industry analysts have described U.S. WPC and WPI as essentially unavailable to new buyers seeking significant volume, with producers reported to have sold forward well into 2026. Established buyers have generally secured their needs through the channels they have long used, while newer or growing buyers face a spot market with limited availability. This reflects how the market developed rather than any single party’s conduct; the structure was simply not designed for a demand increase of this size.
What it means for new entrants and new investment
For a new or growing brand, short-run options can be limited. Without an existing contract or a processor relationship, reliably sourcing isolate in volume has become difficult because much of the available supply is already committed. Some buyers have turned to other regions: reports describe Chinese buyers shifting from the U.S. to Europe, and some European buyers sourcing closer to home. For these buyers, sourcing has become a planning question as much as a purchasing one.
The supply side is responding, but on a multi-year timeline, which is part of why the tightness persists. Building filtration and drying capacity is capital-intensive and slow. Major players are expanding: Glanbia is adding roughly 4,500 metric tonnes of WPI capacity through a joint venture with Southwest Cheese in New Mexico, expected on stream in 2027; Arla has added U.S. capacity through contract manufacturing; and Ireland’s Tirlan has committed about 126 million euro to premium whey capacity expected to be operational by mid-2027. None of these expansions is expected to deliver meaningful new supply until late 2026 or 2027 at the earliest, and most analysts do not expect meaningful relief before late 2026 or beyond.
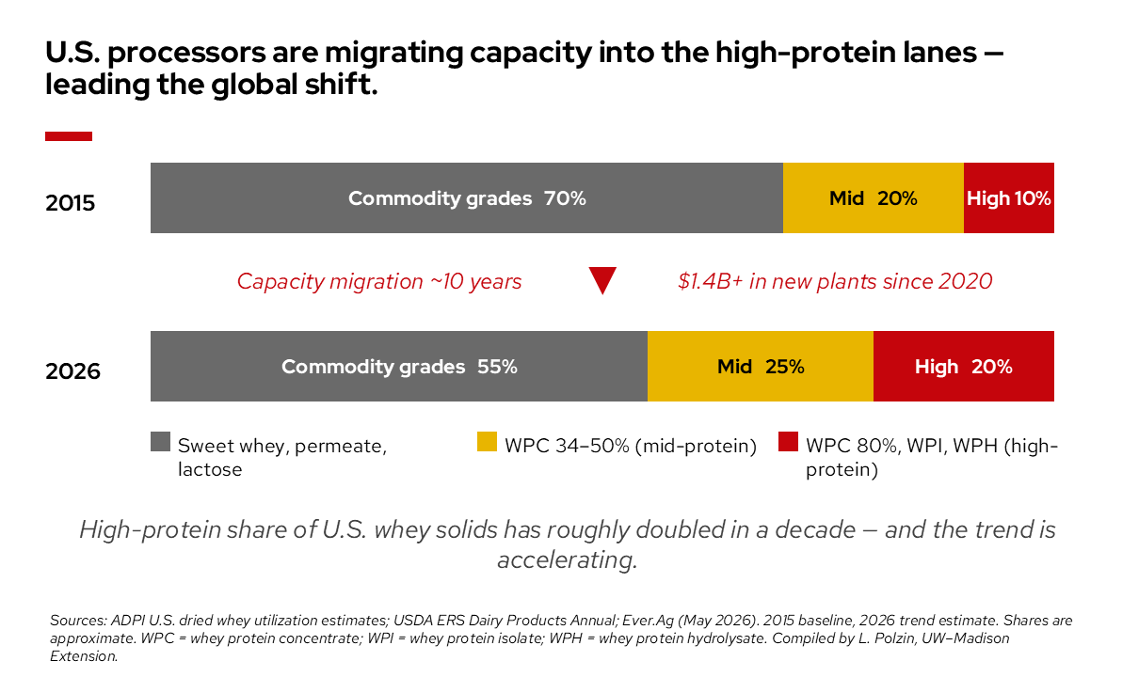
There is a strategic dimension to where this capital is going. U.S. processors have been shifting their product mix away from commodity grades toward the high-protein grades; the high-protein share of U.S. whey solids has roughly doubled over the past decade and continues to rise. The investment reflects a view that protein demand is more structural than passing, and an interest in capturing the value concentrated in that last one percent rather than in the abundant commodity tiers. Because that new capacity is often built to serve committed customers, the timing and availability of supply for buyers without contracts will depend heavily on how these expansions come online.
Part 2: Cottage cheese, the same wave, a different product
A real revival
If high-protein whey is a story about an ingredient meeting a processing wall, cottage cheese is a story about a finished retail product being rediscovered. The numbers are striking. U.S. cottage cheese sales topped $2 billion in 2025, up 19.2 percent in dollar terms and 13.9 percent in volume, according to Circana. That came on top of strong prior years, with sales rising roughly 17 percent in both 2023 and 2024 after an 11 percent increase in 2022. In volume terms the rebound is just as clear: after bottoming out in 2022 at 534.6 million pints, cottage cheese volumes rose 9.4 percent in 2023, 12.5 percent in 2024, and another 14.3 percent in 2025, reaching 746.6 million pints. Per-person consumption tells the same story. After dropping to 1.91 pounds per person in 2022, USDA per-capita use rebounded to 2.37 pounds in 2024, the highest level since 2009 and a reversal of years of decline.
Why it happened
Cottage cheese fits much of what the current consumer is looking for. It delivers about 14 grams of protein per half cup while staying low in calories and carbohydrates, an efficient way to add protein without loading up on other macronutrients. As more Americans seek foods that are high in protein, low in sugar, and compatible with a GLP-1 diet, cottage cheese checks several boxes at once.
What turned a good nutritional profile into a sales surge was repositioning and social media. Viral recipes featuring protein-rich ice creams, cheesecakes, savory dips, pizza crusts, pancakes, and baked goods pushed cottage cheese into the mainstream, and home cooks found ways to use its texture rather than work around it. By spring of 2023, recipes for cottage cheese ice cream were circulating widely online. Challenger brands accelerated the shift by treating the product as premium, promoting clean labels, minimal ingredients, creamier textures, and live cultures, rather than as a diet relic.
How durable this proves to be is an open question. The growth has now persisted across several years rather than a single season, which argues against dismissing it as a passing fad. At the same time, unlike the whey market, there is little structural anchor holding cottage cheese demand at current levels beyond the use of GLP-1’s. There is no capital lock-in or contractual commitment underpinning it; the category is sustained largely by consumer choice, and consumer choice can move. A reading on this market is that the gains are real and have lasted, and rest on consumer preference.
Where cottage cheese feels the pressure
Cottage cheese is made very differently from high-protein whey. It is a cultured, fresh dairy product made largely from milk directly, not a heavily filtered byproduct, so it does not face the membrane-filtration bottleneck. Even so, rapid demand has at times outrun capacity. Some brands have seen increases sharp enough to create spot shortages; Organic Valley’s cottage cheese sales grew over 30% in the first half of 2025, and the cooperative reported that the product was selling faster than it could be made. The constraint here is more conventional: fresh-dairy filling and packaging lines, refrigerated supply chains, and short shelf life. The pattern still rhymes with whey, in that demand arrived faster than the specific equipment to meet it.
There is also a difference in market access worth noting. Where much of the high-protein whey supply is committed through long-term contracts, cottage cheese growth has been more open to newer and challenger brands. Private label led category growth with about $673 million in sales, but branded players posted broad double-digit gains, several growing from the mid-20s to the mid-30s in percentage terms. The finished-goods retail market has had room for new entrants in a way the high-protein ingredient market currently does not, a direct consequence of how differently the two products are made and sold.
The Connecting Theme Between High-Protein Whey and Cottage Cheese
Both products are riding the same consumer shift toward protein. The difference lies in the structure beneath them. Cottage cheese is a finished food that can scale on relatively conventional terms, and its market has stayed open to new players, though its current demand rests largely on consumer preference. High-protein whey is the concentrated tail end of cheesemaking, limited by expensive equipment that takes years to build and shaped by a contracting model that grew out of the product’s small, specialized origins. Understanding the protein boom means recognizing that demand is only half the story. The other half is written in equipment, capital, and the way these markets developed.
Published: July 13, 2026
Reviewed by: Dean Sommer, Cheese & Food Technologist, and Mike Molitor, Process Advisor, University of Wisconsin-Madison Center for Dairy Research
References
- Doering, C. (2026, February 23). Protein powder shortage threatens America’s biggest food craze. Food Dive. https://www.fooddive.com/news/protein-powder-shortage-whey-prices/819625/
- Endlich, J. (2025, November 20). US whey protein shortage is pushing prices to record levels. Vesper. https://vespertool.com/news/us-whey-protein-shortage-is-pushing-prices-to-record-levels/
- FoodNavigator. (2025, December 19). Why is there a whey protein shortage? https://www.foodnavigator.com/Article/2025/12/19/whey-shortage-rocks-dairy/
- Intermountain Nutrition. (2026, April 22). The whey protein shortage: What supplement brands need to know. https://intermountainnutrition.com/the-whey-protein-shortage-what-supplement-brands-need-to-know/
- Macau Nutrition. (2026, March 24). Why whey protein prices are skyrocketing. https://www.macaunutrition.com/blog/whey-protein-price-increase-2025
- New Hope Network. (2026). Consumer demand drives whey protein shortage, price increases. https://www.newhope.com/brands/consumer-demand-drives-whey-protein-shortage-price-increases
- Dairy Reporter. (2026, January 16). Whey protein suppliers race to expand capacity amid tight
- markets. https://www.dairyreporter.com/Article/2026/01/16/whey-protein-shortage-drives-major-global-investments/
- Dairy Reporter. (2026, May 9). How cottage cheese reinvented itself and found new growth. https://www.dairyreporter.com/Article/2026/05/09/how-cottage-cheese-reinvented-itself-and-found-new-growth/
- Dairy Herd. (2026, April 14). The unexpected return of cottage cheese. https://www.dairyherd.com/news/unexpected-return-cottage-cheese
- Meyer, A. (2025, July 26). Cottage cheese got so popular from TikTok, producers are struggling to keep up. CNN Business. https://www.cnn.com/2025/07/26/business/cottage-cheese-tiktok-good-culture
- U.S. Department of Agriculture, Agricultural Marketing Service. (2026). National Dairy Products Sales Report (NDPSR), dry whey weighted price, week ending May 23, 2026. Washington, DC: USDA AMS.
Compiled Analysis and Presentation Graphics
- Polzin, L. (2026). High-protein demand and U.S. dairy product mix [graphic]. Madison, WI: University of Wisconsin–Madison Extension. Sources compiled from Mintel Global New Products Database (GNPD), U.S. high/added-protein food, drink, vitamin, and dietary supplement launches, 2020–2025, indexed (2020 = 100), cross-referenced with Innova Market Insights launch data. GLP-1 = glucagon-like peptide-1 (weight-loss drug class).
- Polzin, L. (2026). Global liquid whey utilization funnel [graphic]. Madison, WI: University of Wisconsin–Madison Extension. Sources compiled from IDF Bulletin No. 525 / 2024 World Dairy Situation; ADPI category estimates; Ever.Ag (May 2026). MMT = million metric tonnes; WPC = whey protein concentrate; WPI = whey protein isolate; WPH = whey protein hydrolysate.
- Polzin, L. (2026). Whey processing flow and the ultrafiltration bottleneck [graphic]. Madison, WI: University of Wisconsin–Madison Extension. Sources compiled from USDA AMS NDPSR; industry trade press spot quotes (May 2026).
- Polzin, L. (2026). Whey product tiers, volume, share, and value [graphic] . Madison, WI: University of Wisconsin–Madison Extension. Composite sources: USDA ERS dairy product utilization; Vesper industry analysis 2025–26; whey industry trade publications. MT = metric tons.
- Polzin, L. (2026). High-protein demand and U.S. dairy product mix [graphic]. Madison, WI: University of Wisconsin–Madison Extension. Sources compiled from Mintel Global New Products Database (GNPD), U.S. high/added-protein food, drink, vitamin, and dietary supplement launches, 2020–2025, indexed (2020 = 100), cross-referenced with Innova Market Insights launch data. GLP-1 = glucagon-like peptide-1 (weight-loss drug class).
Infographics
(Click to enlarge)