Producers are examining price ratios to determine relative profitability and observe early warning signs between alternatives as they finalize planting intentions. One of the price ratios that generates much attention is the soybean-corn price. If the ratio is greater than 2.5, it is more profitable to produce soybeans. This article examines the national and Wisconsin soybean-corn price ratios starting from 2005/6 marketing year. The primary data source for this analysis is the U.S. Department of Agriculture National Agricultural Statistical Service (NASS) Quick Stats.
The soybean-corn price ratio varies annually, but its mean is now close to the benchmark value of 2.5. Although the production ratio may explain this annual variation, this article does not find a statistically significant association between the two variables. Producers may consider input costs, weather conditions, and productivity rather than the price ratios in finalizing their planning intentions.
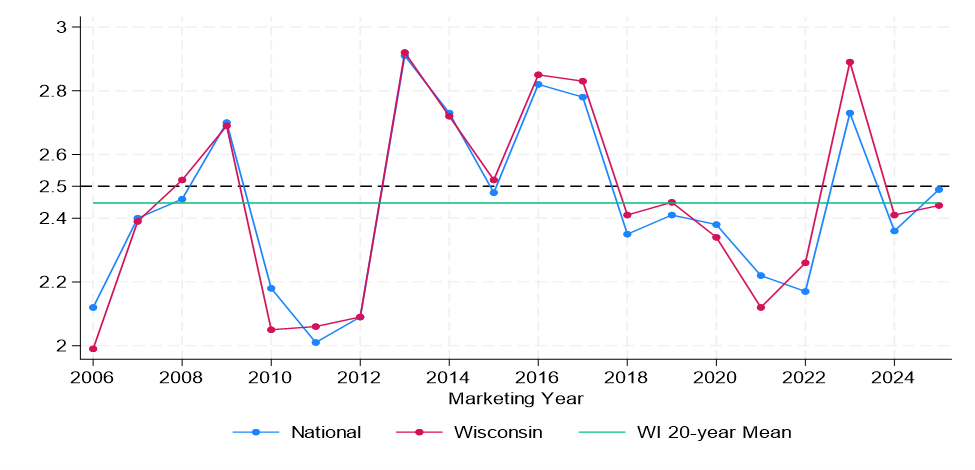
Historically, this ratio has fluctuated around a 20-year average of 2.45, reaching a low of 1.99 in 2006 and a high of 2.92 in 2013 with a 0.30 standard deviation in Wisconsin. The national price ratio has an average of 2.44 with the minimum of 2.01 in 2011 and the highest of 2.91 in 2013. The standard deviation for the national ratio is 0.27. A nearly perfect correlation exists between Wisconsin and the national price ratios that show identical patterns over the years. Figure 1 displays the national and Wisconsin soybean-corn price ratios from 2006 to 2025. The individual price ratios do not show any clear or consistent patterns.
Figure 1: Soybean-Corn Price Ratio
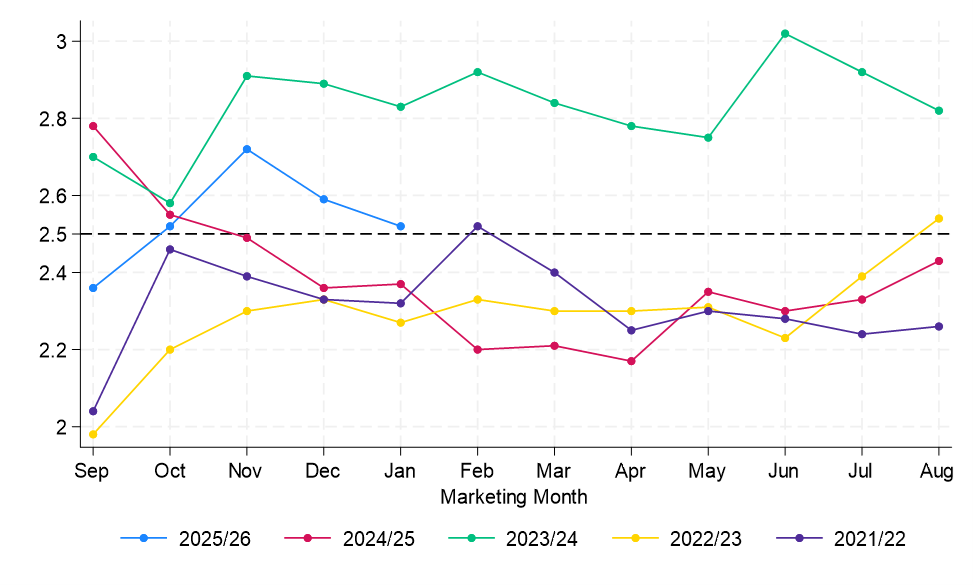
This article examines whether a clear trend emerges with monthly price ratios in Figure 2, beginning with the 2022 marketing year through the present. The monthly ratios mostly lie below the benchmark value in the marketing years 2024/25, 2022/23 and 2021/22. In the current marketing year, the ratio increased from 2.36 in September 2025 to 2.52 in October 2025. The ratio further increased to 2.72 in November 2025. However, it declined to 2.59 in December 2025. It declined further to 2.52 in January 2026. Since October 2025, the ratio has remained above the 2.5 benchmark value.
Figure 2: Monthly Soybean-Corn Price Ratio
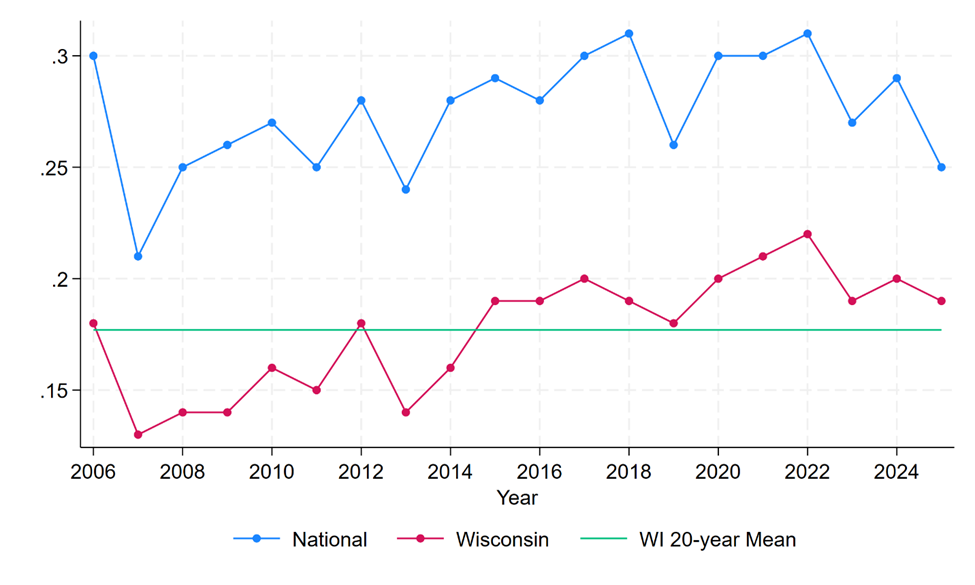
The fluctuations in the annual price ratios raise concerns about their determinants. One plausible driver is the ratio of U.S. soybean and corn production. Figure 3 shows the ratio of soybeans to corn production, measured in bushels. As the price ratios, the U.S. soybean-corn production has fluctuated over the years. In the U.S., the average ratio is 0.28 with a standard deviation of 0.03. This suggests that U.S. soybean production is approximately 28 percent of corn production. The average is 0.18 in Wisconsin, which is 10 percentage points lower than the national average. The production ratio is weakly negatively correlated with the price ratio, with a correlation coefficient of -0.20. This association is not statistically significant at conventional levels. Other plausible drivers of the price ratio include the interplay of factors affecting both the demand and supply of corn and soybeans.
Figure 3: Soybean-Corn Production Ratio
In sum, the soybean-corn price ratio varies annually, but its mean is close to the benchmark value of 2.5. Although the production ratio may explain this annual variation, this article does not find a statistically significant association with the two variables. Producers may consider input costs, weather conditions, and productivity rather than the price ratios in finalizing their planning intentions.
References
LaPorte, J. (2026). Understanding the corn-soybean ratio and its uses. Michigan State University Extension.
Zulauf, C. (2013). Soybean–Corn Price Ratio Since 1975. farmdoc daily, 3(170).