ARTICLE Contents
Historic margin outcomes and payment frequency, 2019–2025
Why payments are lumpy and why duration matters
What the 2019–2025 margin history shows about duration at the $9.50 trigger
Why this matters for business planning
Historic net benefit, one illustrative example
Introduction
This article provides a practical, source-based overview of the Dairy Margin Coverage (DMC) program for the 2026 coverage year, with emphasis on program changes implemented for 2026 and what official margin history from 2019 through 2025 implies for risk management decisions.
Enrollment Window for 2026
Enrollment for the 2026 DMC coverage year is open from January 12 through February 26, 2026. Enrollment is completed through the local USDA Service Center.
How DMC works
What triggers payment:
DMC is a national margin protection program. The monthly DMC margin equals the U.S. All Milk Price minus a standardized feed cost formula based on corn, soybean meal, and premium alfalfa hay. When the monthly margin falls below the coverage level selected by the producer, an indemnity is triggered for that month on the covered share of the operation’s production history.
Coverage choices producers make:
- Coverage level
Producers choose a coverage level from $4.00 to $9.50 per cwt in $0.50 increments. The $4.00 level is catastrophic coverage.
- Coverage percentage
Producers select the share of production history to cover, from 5 percent to 95 percent in 5 percent increments.
- Tier structure
Premium rates and allowable coverage differ between Tier 1 and Tier 2.
What changed for 2026
The 2026 changes are implemented through USDA’s final rule published in January 2026, together with USDA program guidance released for the 2026 enrollment period.
- Tier 1 expands to 6 million pounds
Beginning in 2026, Tier 1 applies to the first 6 million pounds of production history. This expands the amount of milk eligible for Tier 1 premium rates for operations whose production history is between 5 and 6 million pounds.
- Tier 2 remains, with a lower maximum coverage level
Production history above the Tier 1 threshold is covered under Tier 2 rules. Tier 2 has a maximum coverage level of $8.00 per cwt, compared with the Tier 1 maximum of $9.50.
Practical implication
For operations above 6 million pounds of production history, a complete DMC election involves coordinating two tiers. Tier 1 elections can be made up to $9.50, while Tier 2 elections are capped at $8.00.
- Production history is reset for 2026
For 2026, USDA resets production history to reflect more recent marketing years. For existing dairy operations, production history is based on the highest annual milk marketings in one of 2021, 2022, or 2023, subject to program definitions and documentation requirements. The rule also specifies how new dairy operations establish production history.
- Six-year lock-in option with a premium discount
During the 2026 election period, producers may elect to lock in coverage elections for coverage years 2026 through 2031. Premiums are discounted by 25 percent under the lock-in option, subject to program conditions described in the final rule and USDA guidance.
Practical implication
The lock-in decision is primarily a pricing and risk continuity decision. It trades annual flexibility for premium savings and consistent protection across multiple years.
Historic margin outcomes and payment frequency, 2019–2025
The most direct way to describe how often DMC can trigger is to use the official monthly margin series, Milk Margin Above Feed Costs for DMC.
| Year | Months <$4.00 | Months <$8.00 | Months <$9.50 | Avg Margin ($/cwt) |
| 2019 | 0 | 2 | 7 | $9.61 |
| 2020 | 0 | 2 | 5 | $9.45 |
| 2021 | 0 | 9 | 11 | $6.92 |
| 2022 | 0 | 0 | 2 | $10.73 |
| 2023 | 2 | 8 | 11 | $6.70 |
| 2024 | 0 | 0 | 2 | $11.98 |
| 2025 | 0 | 1 | 1 | $10.99 |
| Total (84 mo) | 2 | 22 | 39 | $9.48 |
| Percent of Months | 2.38% | 26.19% | 46.43% |
Source: USDA FSA DMC monthly margins, aggregated (U.S. Department of Agriculture, Farm Service Agency, 2026a).
Table 1 summarizes how often margins fell below common trigger levels, while Figure 1 shows that those trigger months typically occur in multi-month runs rather than as isolated events.
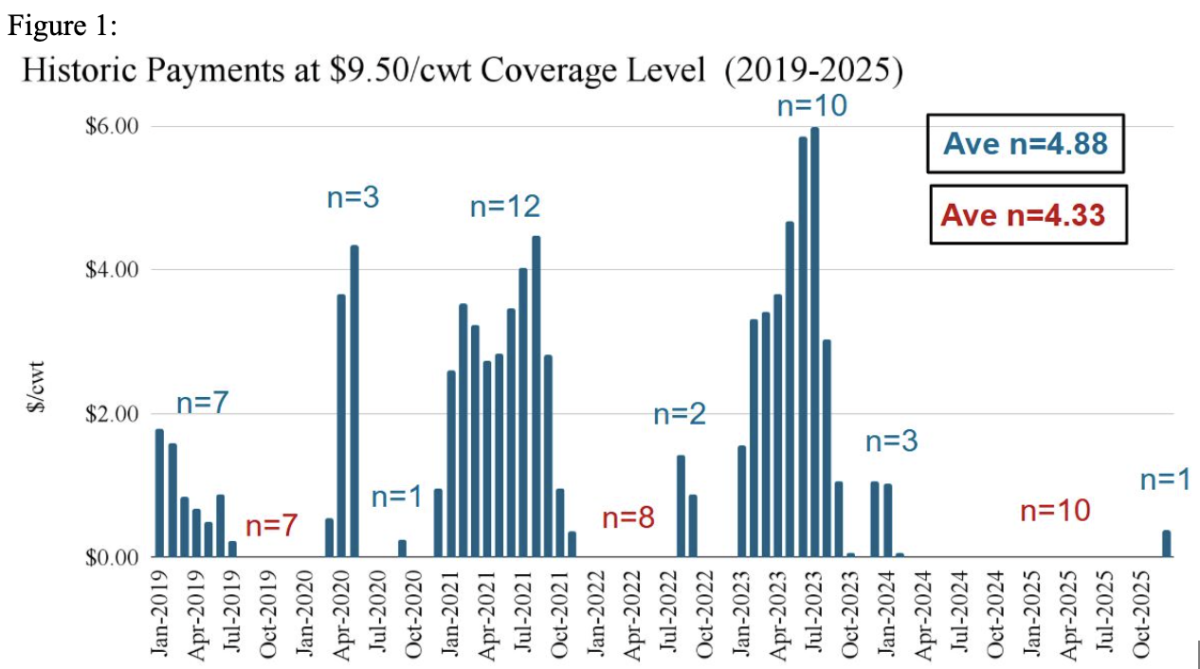
Figure 1 illustrates the “lumpy” nature of DMC payment months at the $9.50 coverage level from 2019 through 2025. A payment month is defined as a month when the official DMC margin is below $9.50 per cwt. The labeled values (n=) show the length, in months, of consecutive runs with payments and consecutive runs without payments. Over this period, runs with payments averaged 4.88 months and runs without payments averaged 4.33 months. The main practical takeaway is that margins tend to move in episodes rather than in isolated one-month shocks. When a downturn reaches the $9.50 trigger, it has historically persisted for multiple months, and periods above the trigger have likewise often lasted several months. For business planning, this reinforces that the relevant risk is frequently the duration of tight margins and the associated working-capital strain, not only whether a single-month payment occurs.
Key interpretation
- Payment frequency is highly uneven across years. From 2019 through 2025, 39 of 84 months (46.43 percent) were below $9.50. However, most of these months occurred in 2021 and 2023, while 2022 and most of 2024 and 2025 were largely above $9.50.
- Lower triggers occur much less often. Only 2 of 84 months (2.38 percent) were below $4.00, and 22 of 84 months (26.19 percent) were below $8.00. This matters for Tier 2 decision-making because Tier 2 coverage caps at $8.00.
Why payments are lumpy and why duration matters
DMC tends to protect against a duration problem, not a single-month problem. When the national DMC margin falls below a high trigger, such as $9.50 per cwt, it has historically tended to remain below that trigger for multiple consecutive months. Likewise, periods above the trigger have often persisted for multiple months. This matters because sustained tight margins can create compounding working-capital and liquidity pressures that are qualitatively different from a one-month shortfall.
What the 2019–2025 margin history shows about duration at the $9.50 trigger
Using the official monthly margin series, there were 39 months from 2019 through 2025 when the margin was below $9.50 per cwt. Those months were not evenly scattered. Instead, they occurred in runs. Over this period, runs with payments averaged 4.88 months, and runs without payments averaged 4.33 months (Figure 1). Put differently, when the margin environment shifts into a “payment regime” at $9.50 coverage, it has historically tended to persist for several months, and when it shifts out of that regime, it has also tended to remain out for several months.
Selected examples of multi-month runs below $9.50
These examples are descriptive, not forecasts.
- January 2019 through July 2019: 7 consecutive months below $9.50
- December 2020 through November 2021: 12 consecutive months below $9.50
- January 2023 through October 2023: 10 consecutive months below $9.50
- December 2023 through February 2024: 3 consecutive months below $9.50
Why this matters for business planning
- Liquidity planning should focus on how long margins may stay tight.
- Multi-month downturns can stress cash flow through feed procurement, operating credit utilization, payroll timing, and debt service, even when the per cwt payment rate varies across months.
- Coverage decisions are better framed around downturn duration than around a single-month trigger or forecast.
- A $9.50 election should be evaluated as protection against sustained tight margins, not as a strategy dependent on isolated payments.
- Tier 2 decisions should be evaluated against the frequency of margins below $8.00
- Since Tier 2 coverage cannot exceed $8.00, the relevant historical question is how often margins fall below $8.00 and whether that risk is material for the operation’s cost structure and leverage.
Historic net benefit, one illustrative example:
Some producers find it helpful to view historic performance as net indemnity minus premiums under an assumed production history, coverage percentage, and tier elections. A historic performance review of Tier 1 coverage at the $9.50/cwt coverage level and 95% coverage for 2019–2025 reports 39 payout months out of 84 months and shows net benefits concentrated in a few years, consistent with the lumpy payment pattern described above. Additionally, it has the average net indemnity per cwt at $0.83, cumulatively equaling $347,584.39.
Such tools can be useful for intuition, but election decisions should ultimately be grounded in the operation’s own cost structure, liquidity constraints, and risk tolerance.
What producers should do before February 26th
- Confirm the operation’s updated production history and document marketing as required.
- The production history reset can change both the covered quantity and tier allocation relative to prior years.
- Contact your milk processor for previous production records.
- Decide Tier 1 and Tier 2 coverage levels intentionally
- Tier 1 can be elected up to $9.50, while Tier 2 caps at $8.00.
- Evaluate the six-year lock-in option separately from payment expectations
- The lock-in option is a premium discount decision under uncertainty, and it may be more attractive for operations that place a higher value on stable coverage parameters across multiple years.
- Finalize elections with the local USDA Service Center by February 26
- Timely enrollment is required for 2026 coverage.
Conclusion
DMC enters 2026 with four practical updates:
- Tier 1 expands to 6 million pounds
- Tier 2 remains capped at $8.00
- Production history is reset based on more recent marketing years
- The highest annual milk marketings in 2021, 2022, or 2023
- A six-year lock-in option is available with a 25 percent premium discount.
Official margin history from 2019 through 2025 shows that payment eligibility at the $9.50 level is often concentrated into multi-month episodes rather than isolated single months. Producers and lenders should therefore evaluate DMC elections in terms of what a sustained tight margin period would imply for liquidity, operating credit use, and risk tolerance, rather than focusing solely on whether a single month payment might occur.
Published: Feb. 16, 2026
Reviewed by: Jackie McCarville, Regional Dairy Educator, UW–Madison Extension and Angie Ulness, Regional Dairy Educator, UW-Madison Extension
References
- Congressional Research Service. (2025, January 29). Farm bill primer: Support for the dairy industry (IF12202). Congressional Research Service.
- U.S. Department of Agriculture. (2026, January 12). Changes to Agriculture Risk Coverage, Price Loss Coverage, and Dairy Margin Coverage programs (Final rule). Federal Register.
- U.S. Department of Agriculture, Farm Service Agency. (2026a). Dairy Margin Coverage program updates and prices: Milk margin above feed costs for DMC. U.S. Department of Agriculture.
- U.S. Department of Agriculture, Farm Service Agency. (2026b, January 13). USDA announces enrollment period for 2026 Dairy Margin Coverage. U.S. Department of Agriculture.